Churn Prediction — Leakage-Free Retention Model
Context
A churn model for a subscription product. The value of the project is not the algorithm but the discipline: features are computed “as-of” a snapshot date, the target is a future inactivity window, and the split is chronological, so the model is evaluated the way it would be used in production. It is the same principle as A/B analysis: no leakage from the future into the moment being modelled.
Data & Method
The data is synthetic and deterministic (seed = 42): 12,000 users sign up between Jun 2023 and Jan 2024, a channel-driven tenure (exponential lifetime) and a plan-driven daily activity probability; activity decays slightly approaching churn, giving a churn rate of ~16% per snapshot.
Features and label
- As-of features — recency, activity over prior 7/14/30 days, tenure, recent trend, average sessions, plus categorical
channel/device/country/plan. - Leakage-free label — churn = no activity in
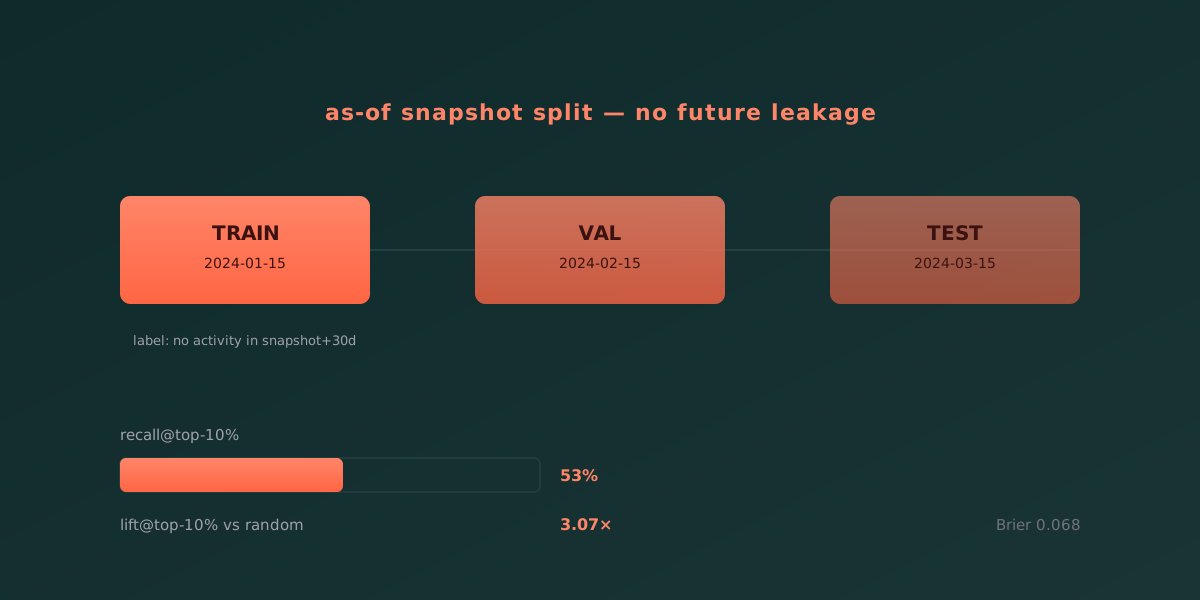
[snapshot, snapshot+30d]for a user who was active in the prior 30 days. Long-dead users are excluded rather than labelled: predicting on ghosts is not a real task.
Split and metric
- Chronological split — train (2024-01-15) -> val (2024-02-15) -> test (2024-03-15). A random split would put a user’s future activity into training and their past into test — silent leakage, and eliminating it is the whole reason the project exists.
- Business metric first — ROC-AUC and PR-AUC are reported, but the decision metric is recall@top-decile and lift@top-decile: if retention acts on the top 10% riskiest users, how many actual churners do we catch.
Model and tests
- SHAP — LightGBM’s native
predict_proba(pred_contrib=True)(TreeSHAP without theshappackage).recency_daysdominates. - Baseline — a balanced logistic regression.
- Tests — 5 pytest tests: balance, leakage, recency correctness, model beats baseline.
| Metric (test snapshot) | LightGBM | LogReg (balanced) |
|---|---|---|
| ROC-AUC | 0.904 | 0.917 |
| PR-AUC | 0.809 | 0.825 |
| Recall@top-10% | 0.53 | 0.54 |
| Lift@top-10% | 3.07x | 3.08x |
| Brier (calibration) | 0.068 | 0.099 |
Run
# Python >=3.10. Deps: pandas, numpy, scikit-learn, lightgbm, matplotlib.
uv run --with pandas --with numpy python data/generate_data.py
uv run --with pandas --with numpy --with scikit-learn --with lightgbm --with matplotlib python run.py
uv run --with pandas --with numpy --with scikit-learn --with lightgbm --with matplotlib --with pytest pytest -q
Outputs land in reports/: metrics.json + evaluation.png (ROC, PR, SHAP bar).
Findings
AUC is a near-tie (the synthetic features are nearly linear, so logistic regression is competitive), but LightGBM is meaningfully better calibrated (Brier 0.068 vs 0.099) — which matters when scores drive retention spend. Honest finding: a strong recency feature makes the lift modest; the value of the project is the leakage-free setup and the business metric, not a GBM trophy.
Impact
- Chronological snapshot split — no future activity leaks into training.
- Future-window label — we do not predict on long-departed users.
- Business metric first — recall@top-10% 0.53, lift@top-10% 3.07x.
- Calibration — Brier 0.068 (LightGBM) vs 0.099 (LogReg): the score is usable for retention-spend decisions.