Viewing as: Manager Switch: HR Colleague

Product Analyst

Decisions from data, with a measurable effect

I ship decisions, not dashboards: which fix to switch on, whom to win back, where the hypothesis failed.

5 years in data
17 portfolio projects
+5.72 pp KYC conversion
€656K/yr annual fix impact

Business figures: portfolio case Volta (synthetic data) — not employment results.

Stack

Analysis SQL Python DuckDB
Experiments A/B Causal Inference
Infra GitHub Actions Supabase PostHog
All projects →

All projects

— reorder with Arrow Up/Down Volta Neobank — Product Analytics

Experiments

Volta Neobank — Product Analytics

Situation
«Volta» is a fictional neobank losing users during onboarding: every team had its own number, and none explained where the money leaked
Task
Find the critical onboarding step and prove it so the conclusion cannot be dismissed as a convenient sample
Action
One discover → validate → measure → optimize loop: funnel, KYC progress-bar A/B, cohorts, KMeans segmentation, DiD causality check
Result
KYC fix: +5.72pp conversion (p<0.0001) → €656K/yr at 44× ROI; M3 retention +9.2pp
Pythonpandas / NumPy +4
— reorder with Arrow Up/Down Causal / Uplift — CUPED and Individual Treatment Effects

Experiments

Causal / Uplift — CUPED and Individual Treatment Effects

Situation
A two-sample t-test ignores the pre-period: experiments ask for more traffic than needed and retention offers go to everyone
Task
Implement CUPED and uplift modeling and prove neither is biased where the true answer is known in advance
Action
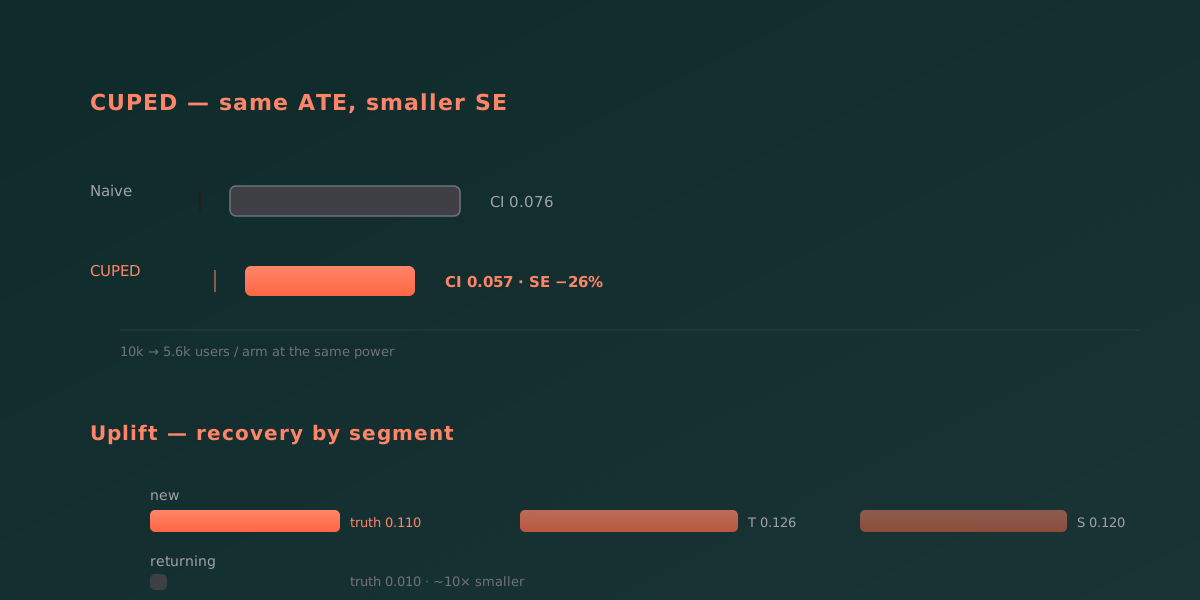
CUPED on a pre-period covariate and T-/S-learners on LightGBM; checked against ground truth with AUUC and QINI
Result
Standard error down ~26%; 5.6k users per arm instead of 10k; new users respond ~10x more than returning ones
PythonLightGBM +5
— reorder with Arrow Up/Down Cohort Analysis Dashboard

Analytics

Cohort Analysis Dashboard

Situation
Cohort retention and LTV on synthetic data: average retention hides the per-cohort dynamics
Task
Make retention and LTV readable per acquisition cohort rather than as a single average
Action
Retention matrix, ARPU and LTV by cohort, observation-age correction, Tableau export (CSV + Hyper)
Result
Cohort matrix instead of average retention: churn speed and where monetization diverges are visible
Pythonpandas +3
— reorder with Arrow Up/Down SQL Analytics Case Study

Analytics

SQL Analytics Case Study

Situation
No production data, and textbook exercises do not show systems thinking: 25 cases on a synthetic dataset
Task
Build cases where every query answers a product question and reproduces with one command
Action
One self-contained .sql per case, data generator on DuckDB, dbt staging → marts layer, regression tests, live report on Pages
Result
The funnel drops 54% at add-to-cart → checkout; retention falls from ~21% (D1) to ~5% (D30); only 3.5% repeat; on real data 72.4% return
SQLdbt +4
— reorder with Arrow Up/Down Churn Prediction — Leakage-Free Retention Model

Analytics

Churn Prediction — Leakage-Free Retention Model

Situation
A churn model for a subscription product: a random split leaks future activity into training
Task
Score the model so its offline quality is not an artifact of leakage
Action
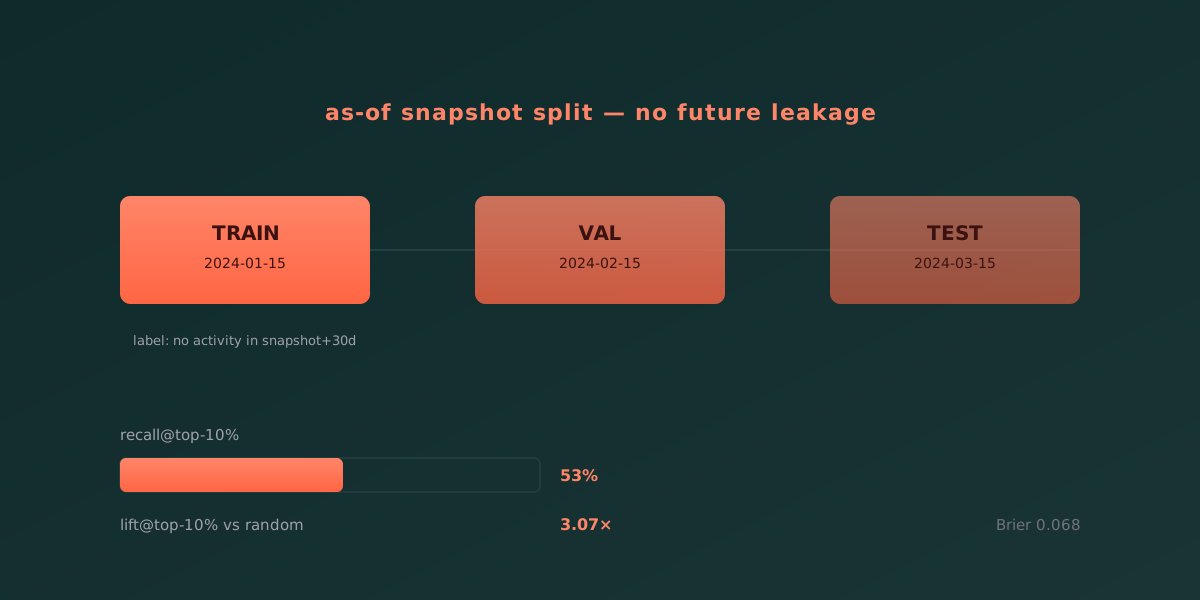
As-of features, a future inactivity label, a chronological split, decisions driven by recall@top-decile and lift
Result
In the top 10% riskiest the model catches 53% of real churners at 3.07x lift
PythonLightGBM +5
— reorder with Arrow Up/Down RFM Analysis of Bank Clients

Analytics

RFM Analysis of Bank Clients

Situation
The bank accumulates client transactions, but marketing sends everyone the same offer
Task
Replace the single offer with targeted segments, each with its own retention strategy
Action
Cleaned the transactions, scored Recency, Frequency and Monetary, segmented clients, visualized the distribution in Tableau
Result
Four RFM groups: a small high-value share drives a disproportionate share of revenue; marketing moved to segmented scenarios
PythonSQL +1
— reorder with Arrow Up/Down Product Analytics + A/B on Supabase

Product

Product Analytics + A/B on Supabase

Situation
Analytics portfolios show metrics on a clean CSV; the hard part is analytics embedded in a real multi-tenant product
Task
Own the multi-tenant setup end to end: auth, per-org isolation, event ingest, and the experiment result computed in the database
Action
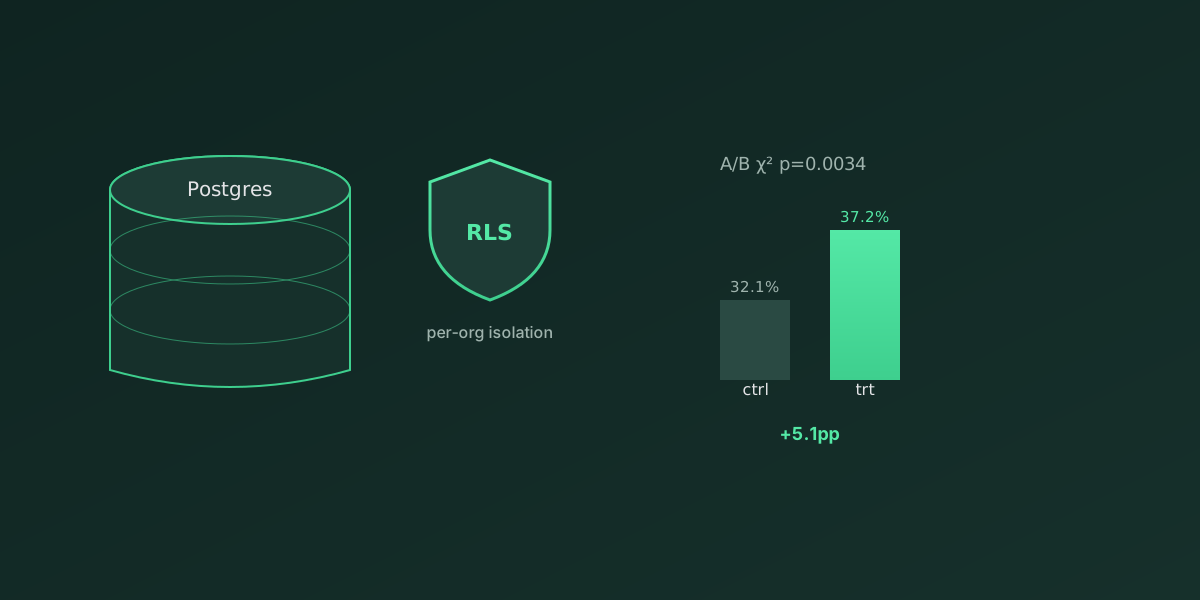
SQL views compute funnel, cohort, MRR, and DAU; v_results computes A/B in the DB; RLS isolates rows per organization
Result
A/B concluded: control 32.1% vs treatment 37.2%, +5.1pp at p = 0.0034 (χ²); metrics computed in the DB for any client
PythonStreamlit +3
View Project

Repo is private — available on request

— reorder with Arrow Up/Down TaskFlow — PostHog Product Analytics Pipeline

Product

TaskFlow — PostHog Product Analytics Pipeline

Situation
An analytics portfolio usually starts from a ready-made CSV; this one starts earlier — with instrumenting the app
Task
Define events without PII leaks, get them into the analytics tool, and turn raw events into decisions
Action
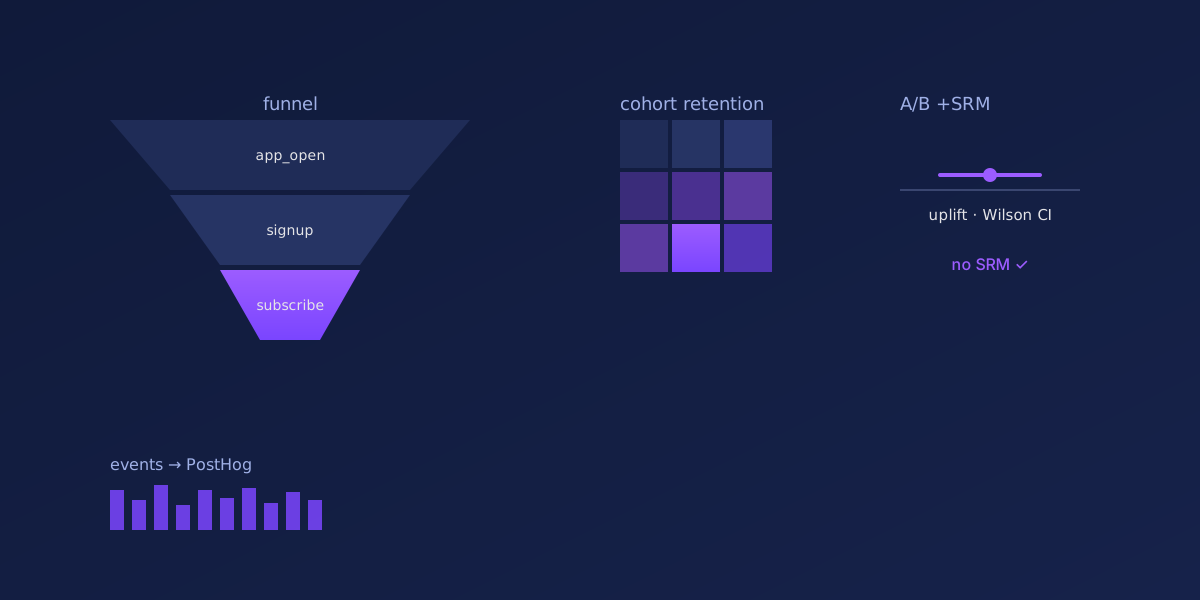
Typed event catalog, PII scrubbing; A/B with chi-square, uplift, Wilson CI, SRM; SQL mirror, Streamlit dashboard, CI, Docker
Result
Full analytics lifecycle: 7 analyses, a typed event catalog with no PII leaks, metrics that reproduce in both Python and SQL
PythonPostHog +5
View Project

Repo is private — available on request

— reorder with Arrow Up/Down This Portfolio Site

Engineering

This Portfolio Site

Situation
A static portfolio on GitHub Pages: projects and posts are edited in Markdown, not in component markup
Task
Make publishing a project a content change, not a code change: a new Markdown file, then a push
Action
Content collections with Zod schemas, withBase() for the base path, no-flash inline theme script, SEO set, push-to-Pages deploy
Result
Invalid frontmatter breaks the build, not the deploy; no link hardcodes the base; adding a project needs no code changes
AstroTypeScript +2