Promo Margin Lab
▶ Static render of the dashboard — built from the same SQL marts as the live Superset; the footer says it is a render
Situation
Promo in offline retail is usually measured with one number: how much sales grew against a pre-period average. That number cannot carry a decision, because a discount is a cost, part of the lift is pulled forward from later weeks, part is taken from neighbouring SKUs, and margin can move the opposite way from revenue.
The product behind this case models promotions before launch: it should answer which depth and which SKU set deliver the best result under constraints. The analyst on that team owns not the model but the measurement — making sure the effect is estimated correctly and translated into money.
Task
I had to build the measurement-and-decision loop: a counterfactual that does not lie, a lift ledger in roubles, promo P&L, a depth ceiling by category, an experiment design, a model-quality metric and a budget allocation — showing at every step where the estimate can be wrong.
Actions
A panel with known truth
561,600 cells: 120 stores × 60 SKUs × 78 weeks, three formats, six categories with 12–35% margin. Promo assignment is not random: the probability rises when the last three weeks were weak. The generator stores eight truth components — base, lift, pantry, cannibalisation, halo, cross-format, noise and an explicit clipping residual — and feature_columns() fails if any truth_* column reaches the features.
Price and depth are attached with an as-of join on the price version effective in the fact week; joining on store_id + sku_id would multiply rows and pick the wrong price.
Counterfactual
Three estimators on the same promos: pre-period mean, a log-linear forecast with store and SKU effects, seasonality and promo-free history, and a DiD against non-promoted peers in the same SKU and format.
The naive baseline understates lift by −15.6%: a four-week average lags the demand dip the manager reacted to. The forecast is off by −0.9%, with WAPE falling from 12.1% to 7.7%. DiD does not rescue it: the confounder is idiosyncratic, so control stores do not share it.
Lift ledger
The ledger is computed per wave (store × week × category) so a non-promo cell is attributed once. Against the oracle: own lift −0.9%, cannibalisation −6.0%, halo +5.7%, net +1.5%. Halo outweighs cannibalisation: net lift is 3.8% above own.
Margin and depth
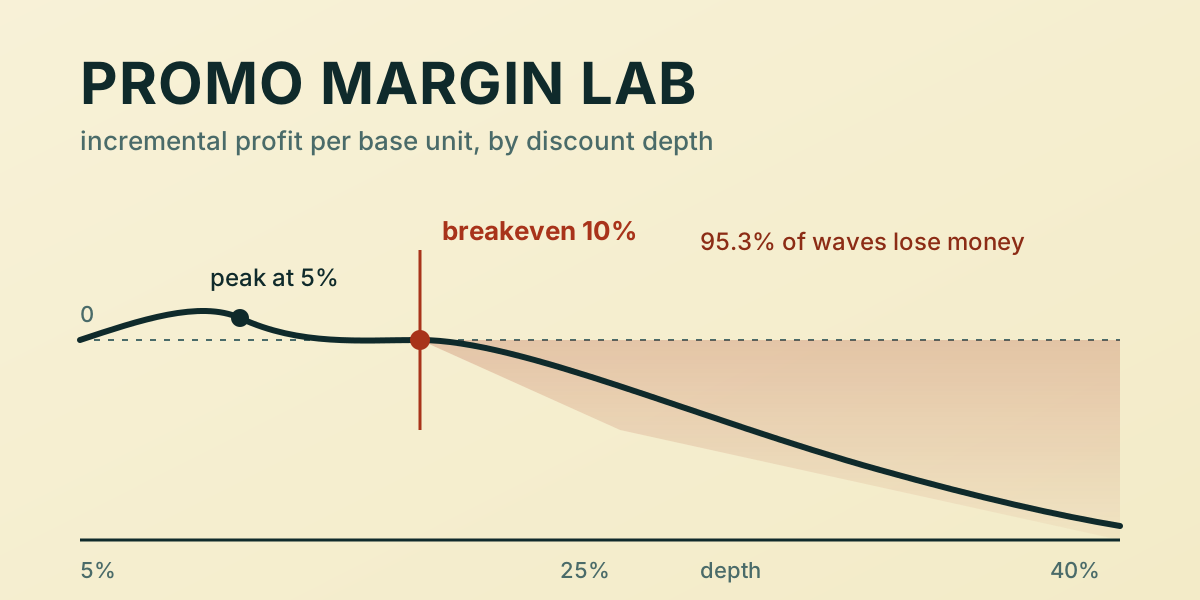
Promo P&L: revenue +70.5 m RUB, discount 60.0 m RUB, supplier funding +15.6 m RUB, incremental profit −17.6 m RUB. 95.3% of waves lose money, median −1 542 ₽. The response curve m(d) = A·(1 − e^(−k·d)) gives breakeven depth: non-food 20.5%, bakery and grocery 10.0%, drinks 4.5%, dairy 2.5%, frozen 2.0% — against an actual average of 25.4%.
Test
Cluster design: store is the randomisation unit, the outcome is incremental margin per store-week. ICC 0.138, MDE 612 ₽ per store-week. Over 1,000 null splits the false-positive rate is 4.7%, power at the MDE 77.8%, CI coverage 95.0%. A classic switchback with a common switch week rejected 100% under the null — week effects absorbed the treatment; a per-store phase with two-way demeaning gives 4.0% and recovers an injected carryover of 0.5 as 0.49.
Model and policy
The model predicts incremental margin per cell: R² 0.925, Qini 0.963 [0.958; 0.967], calibration slope 1.10. At 20% capacity ranking by score loses −55 396 ₽; a threshold of positive score earns +54 361 ₽ on 285 cells; the oracle under the same rule earns +98 280 ₽. The gap between threshold and ranking is +109 757 ₽, CI [97 505; 121 569].
Allocation
One planning week, 4,756 candidates after a six-week spacing rule, depth 5–40% capped at the category ceiling. On a 450.7 k RUB budget: optimiser +222 301 ₽, top-15% +147 472 ₽, random +21 460 ₽. Blanket 15% across all candidates loses −772 224 ₽ on 4.51 m. Greedy matches brute force on a small instance.
On a loose 2.25 m RUB budget the binding constraint is the ceiling, not the money: the optimiser spends 487 k RUB and earns +223 645 ₽ across 1,829 cells, leaving 1.77 m RUB unspent, while top-15% reaches the same ~+225 836 ₽ for 1.27 m RUB. The budget stops being the decision as soon as depth is capped.
Superset and Spark
Four SQL marts and a SQLite mart database. The specification describes three dashboards, while the live instance provisions a single “Promo Margin Lab” dashboard with four charts in a 2×2 grid — the gap is labelled rather than hidden. The static render is built from the same queries and its footer marks it as a render, not the live Superset.
The PySpark job (4.2.0 on a local Java 25) reconciles against pandas on 10 stores and 780 store-week rows: a maximum absolute difference of 0.0 across six metrics and no row missing on either side; the generated plan shows a broadcast join, a window and a shuffle. At 16.6 m rows it materialises 166,000 output rows in 14.1 s on local[4]. That is a correctness check on a single JVM, not a cluster throughput claim — the artefact reports/spark_parity.json says so.
Reproducibility
One entry point, python run.py --stage all, over the stages data, panel, baseline, ledger, experiment, response, allocation, marts and spark. The --fast profile builds a panel nine times smaller (40 stores instead of 120), writes artefacts with a _fast suffix and never overwrites the headline numbers. 83 tests, including the Spark-to-pandas parity check and a guard that no truth_* column reaches the features.
Result
Measurement flips the decision. The naive baseline understates lift by −15.6%, the forecast by −0.9%: a 17.7× difference in bias, and it explains why “the promo worked” and “the promo earned” are different claims.
In money, promo returns +70.5 m RUB of revenue and −17.6 m RUB of incremental profit. 95.3% of waves lose money at a median of −1 542 ₽. The reason is not lift: halo outweighs cannibalisation and net lift is 3.8% above own, but the discount is paid on units that would have sold at full price.
The depth ceiling is 2.0–20.5% by category against an actual average of 25.4%: the limit is breached in all six categories, non-food included, at 30.0% actual against a 20.5% ceiling. The test design delivers an MDE of 612 ₽ per store-week at a 4.7% false-positive rate and 77.8% power.
Qini 0.963 does not save the decision: ranking loses −55 396 ₽, a calibrated threshold earns +54 361 ₽, a gap of +109 757 ₽. On the same budget the optimiser earns +222 301 ₽ against +147 472 ₽ for top-15% and +21 460 ₽ for random.
Decision
The recommendation is not to continue in the current configuration: hold depth at the category ceiling and fund only cells with positive expected margin — 3.7% of candidates rather than the whole catalogue. The reason is not the model but the economics: at an actual depth of 25.4% against a 2.0–20.5% ceiling, the discount eats margin faster than the lift returns it.
What would change it: tiered supplier funding (the data carry a flat rate, so tiers are not modelled), a different elasticity (at a 0.85 multiplier the selection changes by 12% and profit falls to 150 k RUB; at 1.15 it is 9% and 302 k RUB), and a sharper test — an MDE of 612 ₽ per store-week is too coarse to separate policies, while a switchback carries an SE of about 31 ₽.
Limitations
The data are synthetic: that is a feature, not a discount — the truth is known, so the estimator can be scored against an oracle. But real promo decisions need real data: external validation on a public dataset is not done.
Supplier tiers are not modelled: the generator has a flat funding rate, and a tier schedule would be an invented assumption. One planning week is not a season.
Docker Hub is unreachable from the build machine, so Superset runs without Docker — Python 3.11 and pinned requirements. The live instance is verified: SQL Lab returns the same −17.6 m RUB and 9,053 waves as the ledger, and the asset export is committed to the repository.
Documentation
- Case PRD — requirements and acceptance criteria, including honest refusals.
docs/data-contract.md— schemas, formulas and the guaranteed component identity.docs/metric-definitions.md— every number with its denominator.docs/experiment-design.md— pre-registration: unit, MDE, analysis plan, threats.docs/decision-memo.md— the depth decision and its price.reports/superset/dashboard.html— the static render;superset/README.md— how to run the live stack.
Frequently asked
Why does promo lose money if revenue grows?
The discount is paid on units that would have sold at full price too. At an average depth of 25.4% and margins of 12–35%, incremental profit is negative in 95.3% of waves even though revenue grows by 70.5 m RUB.
Why synthetic data?
The generator stores the truth: baseline, lift, cannibalisation, halo and pantry. That lets the estimator be scored against an oracle rather than a story; net lift reconciles to the oracle within +1.5%.
Why is a threshold better than Qini?
At 20% capacity ranking by score loses −55 396 ₽, while a threshold of positive expected margin earns +54 361 ₽ and spends on 3.7% of cells.