Causal / Uplift — CUPED and Individual Treatment Effects
Context
A standard two-sample t-test answers only “does the treatment work on average” and ignores the pre-period. Experiments therefore ask for more traffic than they need, and retention offers go to everyone while only part of the audience responds.
The project closes both gaps with two methods:
- CUPED — variance reduction using a pre-period covariate: the same ATE with a narrower CI, so fewer users are needed for the same power.
- Uplift modeling — estimation of the individual treatment effect (ITE), so offers target the users who actually respond rather than everyone.
Both run on a synthetic randomized experiment with a known heterogeneous effect, so the estimates can be checked against ground truth.
Data & Method
Synthetic, deterministic data (seed = 42), 20,000 users in a randomized experiment:
segment—new(30%) /returning(70%) → heterogeneous treatment effect;x_pre— a pre-period covariate correlated with the outcome (ρ ≈ 0.67);treatment— 50/50, independent of everything (clean randomization);tau_true— the ground-truth individual treatment effect (eval only);y_cont— continuous outcome;y_bin— binary conversion.
CUPED — same ATE estimate, less variance:
| Method | ATE | SE | 95% CI |
|---|---|---|---|
| Naive | 0.270 | 0.019 | [0.232, 0.308] |
| CUPED | 0.276 | 0.014 | [0.247, 0.304] |
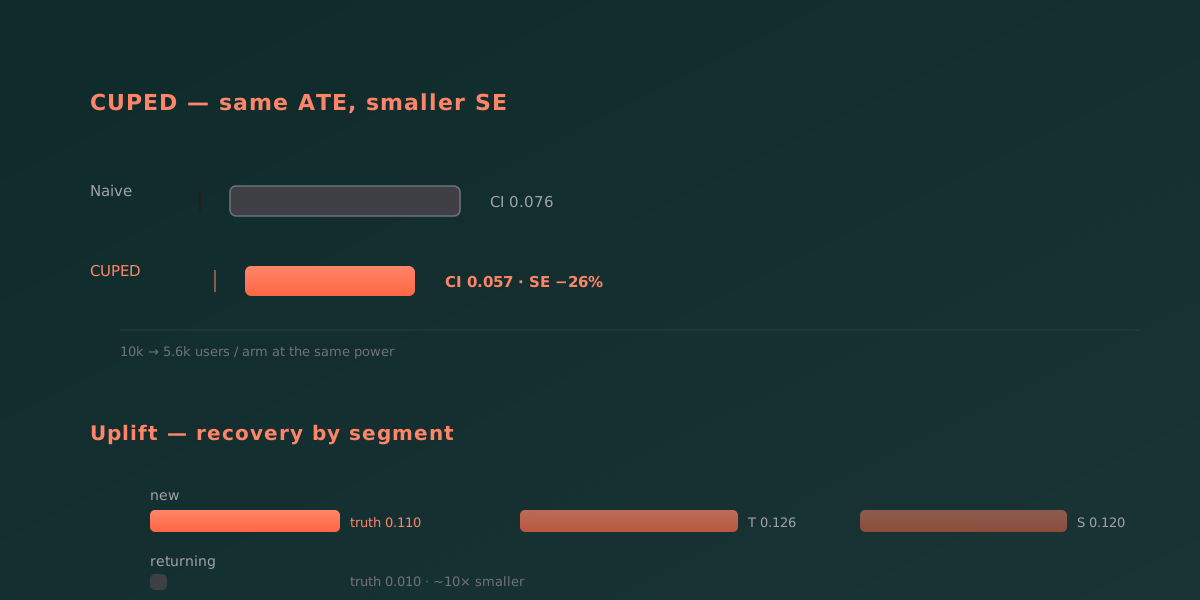
The point estimate is unchanged (0.270 → 0.276, within noise). The standard error shrinks by ~26% (×0.74) and the CI narrows 1.35x. Variance reduction is ~45% actual vs 55% theoretical (the gap is the covariate being a pre-period proxy, not the outcome itself).
Uplift — individual effects, T- and S-learners:
| Model | AUUC | QINI | uplift@20% | corr(τ) |
|---|---|---|---|---|
| T-learner | 0.0043 | 0.0014 | 0.072 | 0.50 |
| S-learner | 0.0057 | 0.0029 | 0.041 | 0.66 |
| Random | 0.0014 | −0.0014 | −0.015 | 0.007 |
A note on honesty: the latent ground-truth τ is 0.60 (new) / 0.08 (returning), but the conversion uplift is ~0.11 / 0.01 because the sigmoid at a high baseline conversion (~71%) damps large latent effects. Comparing predicted binary uplift to latent τ would be a scale mismatch; we report rank correlation (scale-free) and per-segment empirical recovery (same scale).
Run
uv run --with pandas --with numpy python data/generate_data.py
uv run --with pandas --with numpy --with scikit-learn --with lightgbm --with matplotlib python run.py
uv run --with pandas --with numpy --with scikit-learn --with lightgbm --with matplotlib --with pytest pytest -q
Outputs: reports/metrics.json + reports/uplift.png (QINI curves + segment uplift vs ground truth).
Findings
CUPED buys power for free: no new experiment design is needed, only a better estimator on data you already collected — provided a pre-period covariate exists.
Uplift answers a different question than A/B testing: not “does the treatment work on average” but “who does it work on”. The two are complementary, not substitutes.
The model recovered the shape of the effect: “new” users respond ~10x more than “returning” users — the targeting signal a discount campaign would act on.
| Segment | Truth (binary uplift) | T-learner | S-learner |
|---|---|---|---|
| new | 0.110 | 0.126 | 0.120 |
| returning | 0.010 | 0.018 | 0.019 |
Synthetic data with a true heterogeneous effect is the only reason recovery can be checked at all: on real data the ITE is never observed — the fundamental problem of causal inference.
Impact
- CUPED — same ATE estimate, standard error −26%, 95% CI 1.35x narrower.
- Traffic savings — 10k → ~5.6k users per arm at the same power.
- Uplift — T- and S-learners beat random on AUUC, Qini and uplift@20%.
- Targeting — the recovered “new ~10x returning” effect turns discounts from “everyone” into addressed actions.