ML Fundamentals — scikit-learn Pipeline
▶ Data-flow diagram — self-contained HTML, opens in a browser — no install, no build
Situation
Every later ML task — regression, classification, clustering — rests on preprocessing. If the test set leaks into training, or missing values are handled by hand, any model further up the stack is invalidated and the result no longer reproduces on another machine.
The Machine Learning A-Z course supplies the structure, but its code (sklearn.cross_validation, Imputer, OneHotEncoder(categorical_features=)) was removed from scikit-learn in 0.22 — it has to be migrated to the modern API.
Task
I needed the preprocessing built correctly for modern scikit-learn: no leakage into training, no reliance on a random seed, and reproducible at every stage of the pipeline.
Actions
Preprocessing
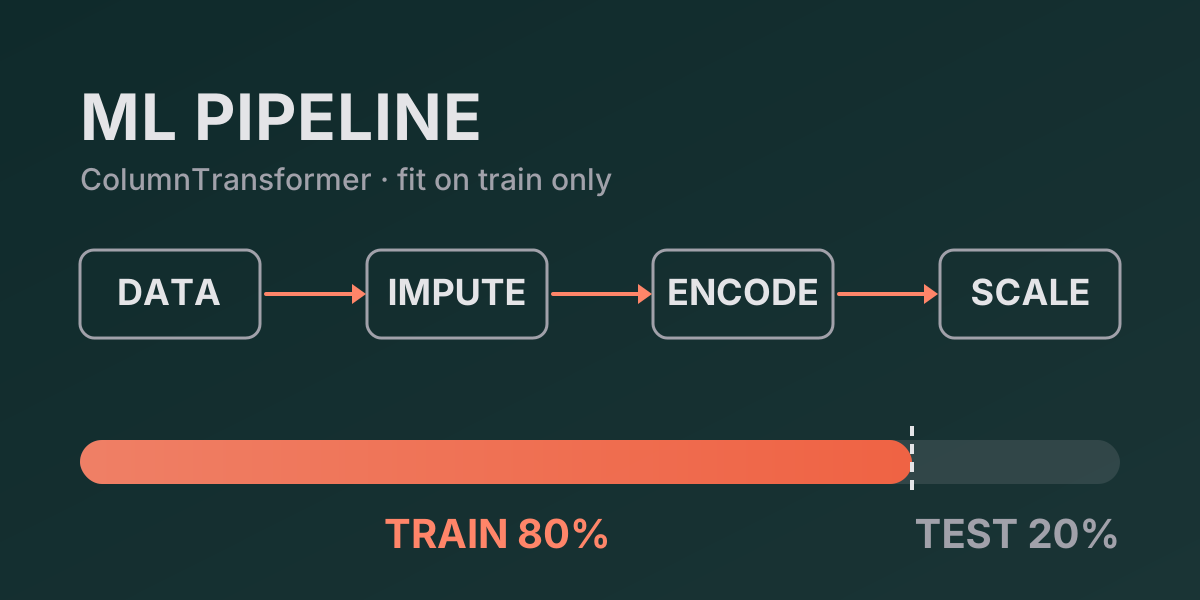
python/data_preprocessing.py builds one ColumnTransformer over Data.csv:
- Missing data — mean imputation via
SimpleImputer. - Categoricals —
OneHotEncoderfor features andLabelEncoderfor the target. - Split — deterministic: rows are stable-sorted by
(Country, Age)and every fifth row becomes the test set, with no random seed. - Scaling —
StandardScaleron numeric columns only.
The whole transformer is fit on the training split only, so no test information leaks into preprocessing.
Datasets and EDA
python/generate_dummy_data.py is a deterministic generator (seeded RNG) for extra datasets, one per pipeline stage:
| File | Rows | Pipeline stage |
|---|---|---|
Data_large.csv |
400 | extended preprocessing |
Salary_Data_large.csv |
300 | simple linear regression |
Housing_Data.csv / .sql |
500 | multiple regression |
Customer_Churn.csv / .json |
800 | classification |
python/eda_plots.py renders a chart for every dataset into output/ — one figure per dataset plus a combined dashboard.png, all in one dark_background style, OO matplotlib, 300 dpi.
Run
pip install -r requirements.txt

cd python
python3 data_preprocessing.py        # prints Train: (8, 5), Test: (2, 5)
python3 generate_dummy_data.py       # synthetic datasets

cd ..
python python/eda_plots.py           # charts into output/
Result
The outcome is a correct, reproducible preprocessing pipeline rather than a model: the test set does not leak into training, and the split repeats on any machine.
- Preprocessing is one pipeline fit on the training split only: the test set does not leak into training.
- The split reproduces without a seed: on
Data.csv— Train(8, 5), Test(2, 5). - Six course datasets plus four synthetic ones (400, 300, 500 and 800 rows).
- EDA charts for each dataset in one
dark_backgroundstyle at 300 dpi, plus a combineddashboard.png. - Code migrated to the modern scikit-learn API; pytest tests keep the pipeline runnable.
Limitations
This is a learning project: the datasets are course and synthetic data, not production. The goal is a correct and reproducible pipeline, not model quality on real data.