Product A/B & Funnel Analytics — Conversion versus Retention
Situation
A subscription B2C service spends on acquisition, but revenue hits a bottleneck. The data live on three grains — user, event, transaction — and 8 616 of 12 000 signups never pay at all. Any monetary metric must declare its denominator explicitly, or numbers across cuts diverge by multiples.
The product team is testing a new onboarding flow. The management question is not «does the variant work» but «should we ship it, and which lever — conversion or retention — moves revenue more».
Task
I needed to answer three questions in one pass: does the variant produce a statistically significant lift in target conversion without breaking arm ratios and guardrails; where the funnel loses users and which step holds the bulk of the loss; and what moves revenue more — conversion uplift or retention — and what the outcome is: ship, extend or stop. The lever comparison required a single step size, otherwise the conclusion would compare quantities of different magnitude.
Actions
Funnel on the user grain
The signup → activation → paid_subscription funnel is computed in DuckDB over unique users: MIN(ts) per step, then COUNT(*) FILTER, with the ordering rule t_k >= t_(k-1). A naive COUNT(*) over events inflates the steps, so the grain is fixed at the user. A variant with renew and segment cuts by channel, platform and country are computed as well.
A/B analysis
The experiment cohort is 2 552 users (control 1 271 / treatment 1 281). The first check is SRM via χ²; without it, downstream p-values are invalid. The target metric is paid given activated: the denominator is activated users, not the whole arm, because that is the step the decision invests in. For the binary metric the analysis reports absolute and relative lift, a 95% CI, the z-statistic and the p-value.
Guardrails and robustness
The secondary metric is activation rate. Guardrails are the refund share and the cancel share among payers. To remove the conditioning risk on post-treatment activation, the same hypothesis is checked with an ITT analogue, paid per signup, over the whole arm. Power and MDE are computed at the observed effect.
Lever comparison at an equal step
Twelve-month unit economics give LTV per acquired user. Both levers are then moved by the same +10% relative step: conversion and retention. This comparison replaced the earlier framing that pitted the conversion lift against a retention-curve shift of a different magnitude.
Reproducibility
The analysis cores are vendored into the repository, so a clean clone runs without external dependencies. Data are synthetic, seed 42, raw CSVs committed. A pytest suite — 16 tests across 5 files — holds the cores, the golden funnel and SQL-to-artifact agreement.
Result
Funnel: the main drop is before payment
| Step | Users | step_conversion, % | overall_conversion, % | Drop-off |
|---|---|---|---|---|
| signup | 12 000 | 100.00 | 100.00 | — |
| activation | 9 623 | 80.19 | 80.19 | 2 377 |
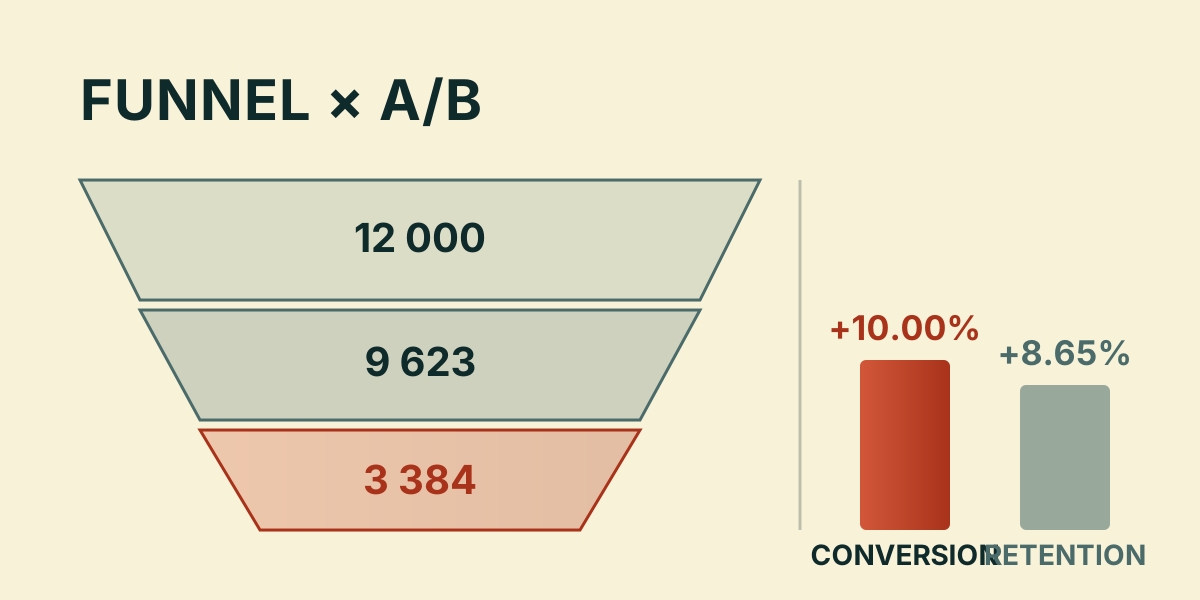
| paid_subscription | 3 384 | 35.17 | 28.20 | 6 239 |
The activation → paid step absorbs 6 239 of 8 616 losses — 72% of the drop. The entrance loses 2 377 users (19.81%). In the extended funnel renew given paid is 76.48% (2 588 users), so post-payment leakage is 7.8 times smaller. Across channels the gap sits almost entirely at payment: referral 33.65% overall versus paid_search 25.79%; across platforms the gap comes from activation (ios 85.41% versus web 72.59%).
A/B: the target metric is significant, guardrails did not degrade
| Check | control | treatment | Effect | p |
|---|---|---|---|---|
| SRM (χ²) | 1 271 | 1 281 | χ²=0.0392 | 0.843 |
| paid given activated | 36.11% (381/1 055) | 43.19% (447/1 035) | +7.07 pp / +19.59% | 0.000946 |
| paid per signup (ITT) | 29.98% (381/1 271) | 34.89% (447/1 281) | +16.41% | 0.007967 |
| activation rate | 83.01% | 80.80% | −2.66% | 0.147 |
| refunds (refunds / charges) | 3.39% | 3.20% | −0.19 pp | — |
| cancels among payers | 48.82% | 46.53% | −2.29 pp | — |
The 95% CI of the relative lift on the target metric is [+8.00%; +31.18%], achieved power is 0.911, MDE 16.30% relative. The observed +19.59% sits above the detection threshold, and the CI lower bound is positive. The ITT analogue gives the same sign and order of magnitude, so the conclusion does not depend on the denominator.
Levers: at an equal +10% step they are comparable
| Lever | LTV per acquired user, RUB | Gain over the 1 594.59 RUB base |
|---|---|---|
| conversion, +10% | 1 754.05 | +10.00% |
| retention, +10% | 1 732.45 | +8.65% |
The ratio is roughly 1.2×, not «several times». The measured variant effect on the ITT base gives LTV 1 856.27 RUB; the conditional lift among activated users extrapolated to everyone is 1 906.97 RUB, but that is an upper bound because activation in the treatment is lower. The conclusion: ship — not because conversion is dramatically stronger, but because its effect is measured and significant while retention has neither an experiment nor an effect estimate.
Difference from volta
The shape is the same as volta (funnel → A/B → ship), but this case’s contribution is the measured comparison of the conversion and retention levers at one step. That is what turns «ship because of a p-value» into a decision with a priced alternative.
Verdict: SHIP
No SRM, the target metric is significant, the effect is above MDE, the direction is robust to the choice of denominator, and guardrails did not degrade. Post-release monitoring keeps activation rate, cancel rate among payers and paid given activated.
Limitations
The data are fully synthetic: the variant’s effect, the shape of the retention curve and the funnel are built into the generator (seed 42), so a significant result is expected by construction and is not evidence about a real product. The target metric is conditioned on activation — a post-treatment variable; the ITT check reduces but does not remove that risk.
Retention has no experiment: the lever comparison is a model at an equal step, not a measured effect. LTV estimates are bounded by a 12-month window, and later cohorts are right-censored. The test was powered to detect effects of 16.30% relative and above — a smaller effect this design would not distinguish from zero.
Documentation
- GitHub → product-ab-funnel-analytics
- README with the verdict and the lever comparison
- Funnel insight
- A/B experiment insight
- LTV and levers insight
Frequently asked
Why is the verdict SHIP if activation is lower in the treatment?
The activation drop is not significant (−2.66%, p=0.147), while the effect on paid conversion is significant and backed by the ITT check paid per signup (+16.41%, p=0.007967). The drop was not built into the generator and is read as noise.
Why is the metric computed among activated users rather than the whole arm?
The target step is paid given activated: it holds 72% of the funnel losses. The conditioning risk on a post-treatment variable is removed by the ITT analogue, which gives the same sign and order of magnitude.
Which lever is stronger — conversion or retention?
At an equal +10% step, conversion adds +10.00% to LTV and retention +8.65% — roughly 1.2 times less. Only the conversion lever is measured and significant.
Can the result be treated as evidence about a real product?
No: the data are synthetic (seed 42) and the variant's effect is built into the generator. The case demonstrates the method and the decision, not a property of a real service.