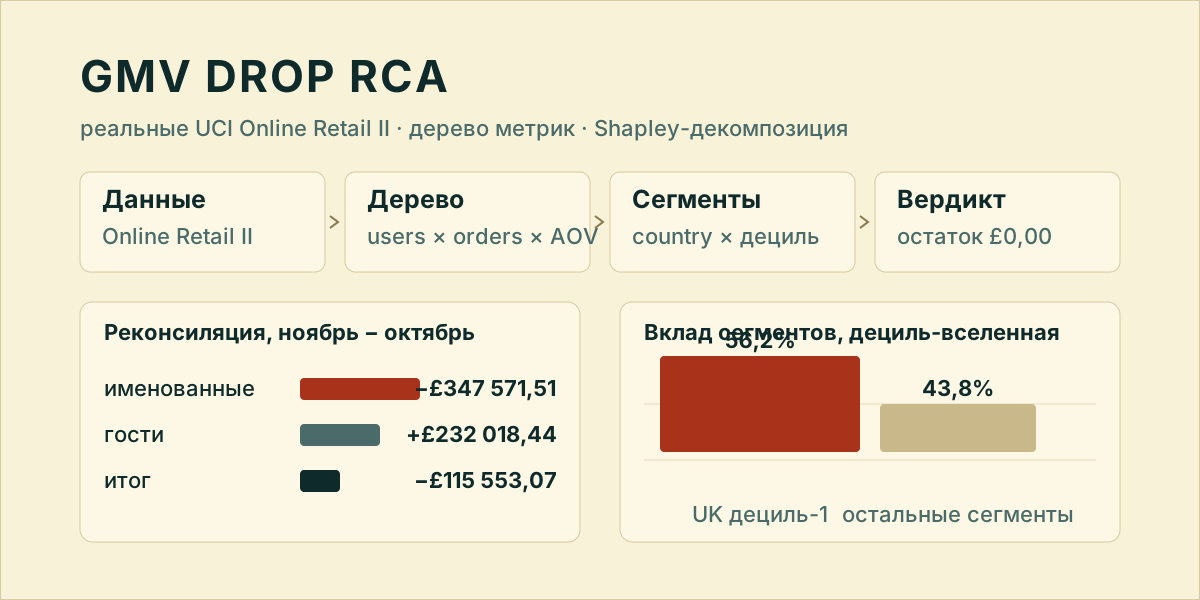
GMV Drop RCA — root cause on real data
Situation
The alert said «GMV dropped 10% month over month», on real UCI Online Retail II transactions.
The total does not answer the only question that matters: where the money went. The same figure is equally consistent with one large segment collapsing, with an assortment shift, or with guest purchases drying up. Until the cause is decomposed by segment, every action is a guess.
Task
I needed to decompose the drop down to a concrete segment and prove the attribution was complete rather than a convenient slice.
Actions
Injection. Seeded a deterministic drop: dropped_gmv 470070.1, customers 544, dropped_invoices 537, target_mom 0.9 (ground_truth.json). The ground truth pins not just the size but the segment tier the RCA verdict must land in.
Metric tree. GMV_total = GMV_named + GMV_guest and GMV_named = users × orders_per_user × AOV. All three factors describe the named population (NOT is_cancellation AND customer_id IS NOT NULL); guest revenue never enters AOV or orders_per_user.
Decomposition. Segments are country × pre-window GMV decile, on the same named population as the tree. Segment contributions come from a Shapley decomposition rather than a naive then-minus-now delta: only the former stays additive when factors interact.
Dashboard. An executive report with findings: reconciliation, tree, top segments and the population caveats.
Checks. Eight tests: Σ factors + residual == ΔGMV_named, GMV_named + GMV_guest == GMV_total, headline numbers pinned with tolerances, the verdict inside the injected tier, and a regression that fails if the tree’s base GMV is ever guest-polluted again.
Result
- Reconciliation (November vs October): named £1,039,318.79 → £691,747.28 (−£347,571.51); guests £115,660.51 → £347,678.95 (+£232,018.44); total £1,154,979.30 → £1,039,426.23 (−£115,553.07, −10.0%). Both identities hold to float precision: residual £0.00.
- Tree on the named population: users +£58,313.86, orders/user +£24,719.26, AOV −£430,402.20; symmetric midpoint residual −£202.43 (0.06% of the named drop) — reported, not hidden.
- AOV: £538.79 → £326.14 (−39.5%) — the injection removed the largest invoices, so the basket collapse is the cause’s signature.
- Root cause: United Kingdom, decile-1, −£195,218.25 = 56.2% of the named drop and 36.9% of the decile-universe drop.
- Cancellation share did not mask it: 7.87% in October → 4.81% in November.
- Full attribution, zero remainder: decile universe −£529,190.59 + customers whose first purchase is in the window +£181,619.08 + guests +£232,018.44 = −£115,553.07. The decile view cannot see the last two groups — they are explicit addends now, not an «unexplained» gap.
- The bug that was fixed: the tree used to mix populations (
usersandordersnamed-only, AOV over total GMV,orders_per_userincluding guests), so the old factor split described no coherent population. The old «169% of the drop» headline is the same defect: £195,218.25 / £115,553.07. Against the named base it is 56.2%; against the decile universe, 36.9%.
Limitations
The data is real, but the drop is injected and seeded: the case tests the correctness of the RCA method, not a reproduction of a real incident.
A decile slice cannot see guests or customers who first bought inside the window by construction — both are carried as addends, so the total reconciles while the «by cause» view stays incomplete inside one table.
Shapley contributions are additive on the chosen population; carrying them to the full base without the addends is not valid.
The tree’s midpoint residual of −£202.43 (0.06%) is a property of a point decomposition, not an error: it is reported and covered by a test with a tolerance.
Documentation
PRD.md— problem statement and acceptance criteria (kept at the project root).- Quick start:
uv sync→uv run python scripts/inject_drop.py→uv run python scripts/rca.py→uv run python scripts/build_dashboard.py. uv run pytest— 8 tests, including reconciliation and the ground-truth tier check.