Classifieds liquidity — a measurability audit
Situation
A classifieds marketplace where the transaction closes off-platform. The platform logs searches, impressions, views, contacts and removals — but never the sale itself. Liquidity is counted from the seller’s self-report: removal_reason == "sold".
That proxy looks reasonable until someone checks it. A seller can remove a listing because of the price, a competitor, or a change of mind, and the metric records a sale. The question is not whether the proxy is wrong, but by how much and whether the error is the same across categories.
Task
I needed to measure how far the proxy drifts from the planted truth per category, and to test whether a paid-visibility decision survives that correction.
Actions
A synthetic base with an answer key. Generated 6,000 listings and 40,000 search sessions over 90 days: 6 regions × 5 categories, seed 42. The answer — the latent sale — is written to _truth/ground_truth.json and is not available to the analysis: an AST test (test_no_truth_leak.py) statically forbids analysis modules from importing or opening that file.
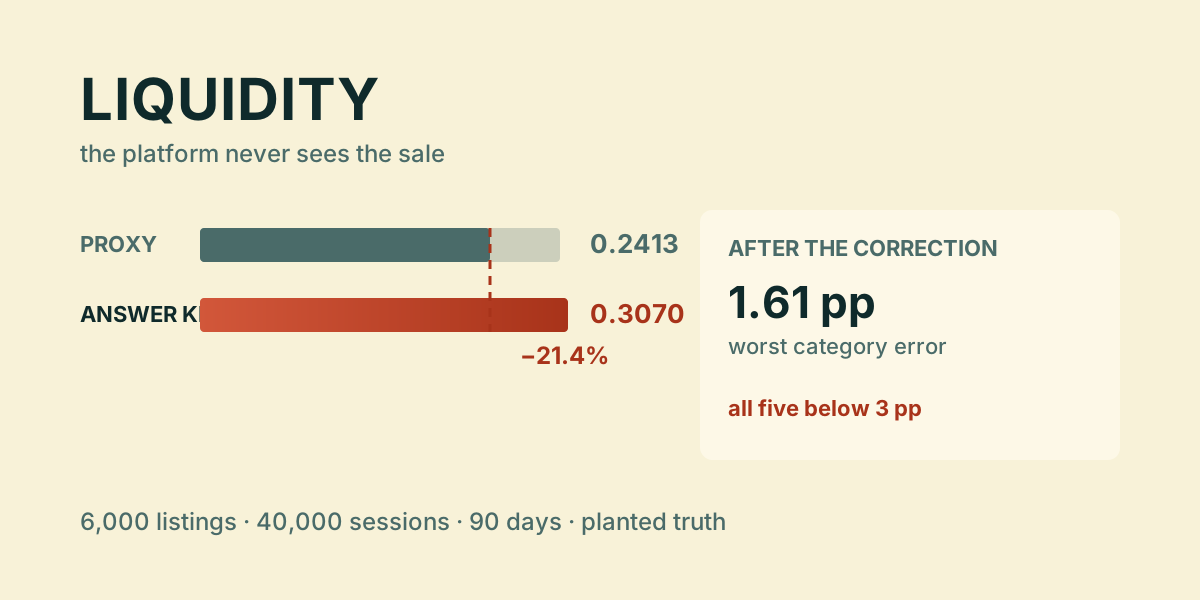
Proxy versus truth. Compared removal_reason == "sold" with the latent truth on the cohort of 1,956 listings published in the first 30 days. The proxy reads 0.2413 against 0.3070 — an error of −0.0657, or −21.4% relative.
The correction. Split the observed reply signal into two components — sold and unsold — and fitted the mixture by EM over reply and lag signals. The correction is per category, not one constant: the proxy error differs between them.
Testing the correction. Scored recovery of the truth on a held-out segment against a 3 pp tolerance, and added a sensitivity test: remove the SOLD_REPLY_LAG_MAX = 4.5 separator or move the cutoff to 2 days and the recovery must break — otherwise the test proves nothing.
Paid visibility. Gave 10% of listings a random within-category boost. Compared the naive before/after read with a contrast against the holdout on contacts per session; measured guardrails separately — organic contacts and reply rate.
Checks. 61 tests: recovery of the truth, separator sensitivity, a must-fail assertion on the naive estimator, no truth leakage, and generator idempotency.
Result
- Proxy error: 0.2413 against 0.3070, −0.0657 (−21.4%) on the cohort of 1,956 listings.
- After the correction: the worst category misses by 1.61 pp; all five stay inside the 3 pp tolerance.
- Naive visibility: 0.4702 → 1.0027 contacts per listing, +113% — selection, not an effect.
- Causal contrast: −0.0116 contacts per session (−2.47%), Welch p = 0.308, interval (−0.0346, 0.0084) — zero is not excluded.
- Guardrails: organic contacts −10.9%, reply rate 56.6% against 64.4% for unpaid listings.
- Negative control: the naive estimator must «improve» — the test fails if it does not.
Limitations
The data is synthetic: this is evidence about a measurement mechanism, not about Avito. The generator defines a world in which the mixture is recoverable, so the correction checks a specification rather than validating against an independent source.
Recovery depends on the separator matching the generator: without it the worst error grows to 12.1 pp, and at a 2-day cutoff to 15.82 pp.
The sign of the causal effect is suggestive, not stable: the interval is wide because sessions are treated as independent while buyers repeat. That is recorded as a limitation, not buried in a footnote.
One seed, one window, no per-listing validation and no window-length sensitivity. All ten limitations are listed in the report.
Documentation
README.md— problem statement, the proxy-versus-truth table, and the boundaries of the claim.docs/preregistration.md— per-category bias signs fixed before the run.- Quick start:
uv sync --all-groups→uv run python -m liquidity.generate→uv run pytest→uv run python -m liquidity.bias. uv run python -m liquidity.monetization— the paid-visibility holdout and guardrails.