ClickHouse — ten SQL cases on 50M rows
Situation
ClickHouse shows a pretty query plan and misleads just as easily: the dialect differs from familiar SQL, uniq returns an estimate, and avg(amount) over an event table is not an average order value. Cases assembled by eye look convincing and disagree with the data on the first recount.
Optimisation has a separate problem. Rewrite the query and add a projection at the same time, and the win cannot be attributed to either change.
Task
I needed a lab where every case is scored against a snapshot and an independent engine, and the optimisation win is measured with the query text held constant.
Actions
Data. Generated 50,000,000 events: users, products, channels, amounts. The MergeTree table is partitioned by month and ordered by (event_date, user_id); the seed is fixed and the parquet file is about 600 MB.
Ten cases. A windowFunnel funnel, cohort retention, 30-minute sessions, gaps-and-islands, LIMIT BY, cohort LTV, argMin/argMax attribution, RFM, approximate uniq, and the tenth case — optimisation.
Cross-engine checks. Wrote a DuckDB twin for seven cases: the same question, a different engine. A divergence signals dialect semantics rather than a «correct» engine. Tolerances are explicit: 0.01 absolute and 1e-9 relative.
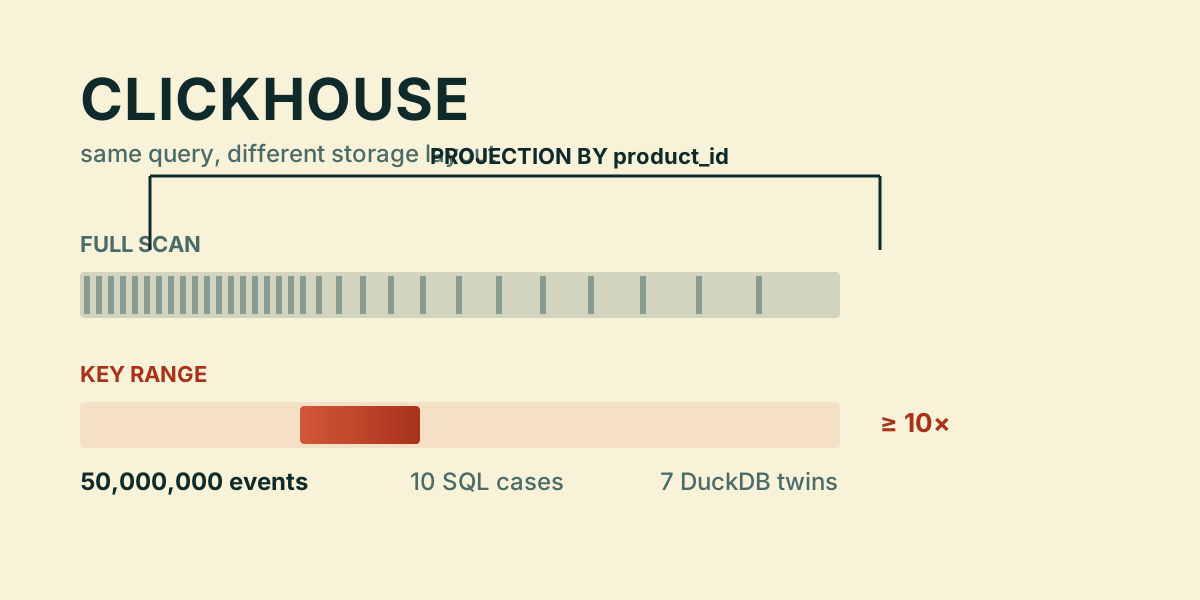
Optimisation without rewriting. Kept slow.sql and fast.sql byte-identical — asserted by a test, not a comment. The only change is ADD PROJECTION ... ORDER BY product_id, after which the same query reads a key range instead of a full scan.
Negative results. Tested PREWHERE and bloom_filter: ClickHouse applies the first automatically, and the second is useless because insertion order is random against product_id, so it matches almost every granule. Both findings are recorded in the case.
Checks. 56 static tests run without Docker: they bind snapshot keys, SQL files and the run.py resolver, forbid module-level skipif, and assert slow and fast SQL are identical. Three integration tests need a live server and skip without one.
Result
- Volume: 50,000,000 events; purchase share 0.1800 (9,001,288 type-4 events), average payment 252.54.
- Cohort LTV: the largest cohort has 810,757 users, 81.3% payers, LTV-30 per user 418.81, and AOV-30 among payers 515.17.
- Approximate
uniq: 1,001,936 against an exact 1,000,000, an error of 0.1936%. - Sessions: 49,711,224 sessions under the 30-minute rule.
- Cross-engine: the snapshot and seven DuckDB twins agree within the stated tolerances.
- Optimisation: slow and fast SQL are identical, and the projection clears the ≥10× speed-up threshold on a full scan.
- Tests: 56 static tests without a server and 3 integration tests; CI separately asserts that
expected.jsonhas not dropped out of the repository.
Limitations
The dataset is a benchmark fixture, not business data: channels and products carry no signal and correlations with the amount are near zero. The cases test SQL and schema correctness, not product conclusions.
amount is structurally zero-inflated: 82.0% of values are zero and non-zero values coincide with purchases. avg(amount) is therefore not an average order value; the README states this.
data/seed.parquet is not committed, weighs about 600 MB and is rebuilt locally. The expected.json snapshot predates the current generator, so numbers may move after the parquet is deleted — a known limitation of the case, not a guarantee of permanent reproducibility.
Integration tests skip without Docker, so CI checks neither the snapshots nor the speed-up. EXPLAIN before and after and clickhouse-benchmark p50/p95 are not attached: the case pins a speed-up threshold, not a measured curve.
Documentation
README.md— the ten cases, the numbers and the boundaries of the claim.cases.md— each case: question, query, result, what it proves.- Quick start:
docker compose up -d→uv sync --all-groups→uv run python scripts/seed.py→uv run python scripts/run.py. - Without a server:
uv run python scripts/run.py --duck-only— DuckDB twins against the snapshot.