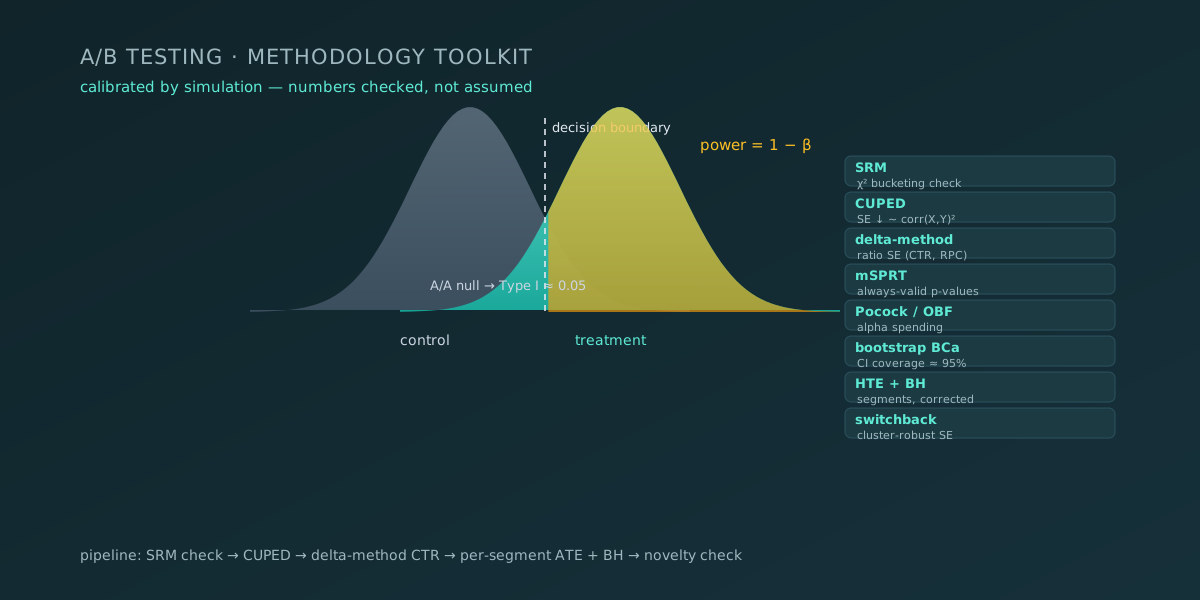
A/B Testing Methodology Toolkit
Calibration-driven A/B testing methods, validated by simulation — SRM, CUPED, delta-method ratio metrics, alpha-spending boundaries, always-valid p-values (mSPRT), bootstrap CIs, HTE, multiple-comparison correction, novelty/primacy and switchback designs. Every module ships with an A/A null check and a power/coverage calibration.
PythonNumPy / SciPypytestuv
Impact: 15 modules, each calibrated by simulation: Type I error ≈ α, power curves, CUPED: SE shrinks by ~corr(X,Y)², Naive peeking inflates Type I error — Pocock/OBF and mSPRT keep it under control, Delta method gives the correct SE for ratio metrics (CTR, RPC) — the naive per-unit t-test is biased, End-to-end pipeline: SRM → CUPED → delta-method CTR → per-segment ATE + BH → novelty check
Product Analytics + A/B on Supabase
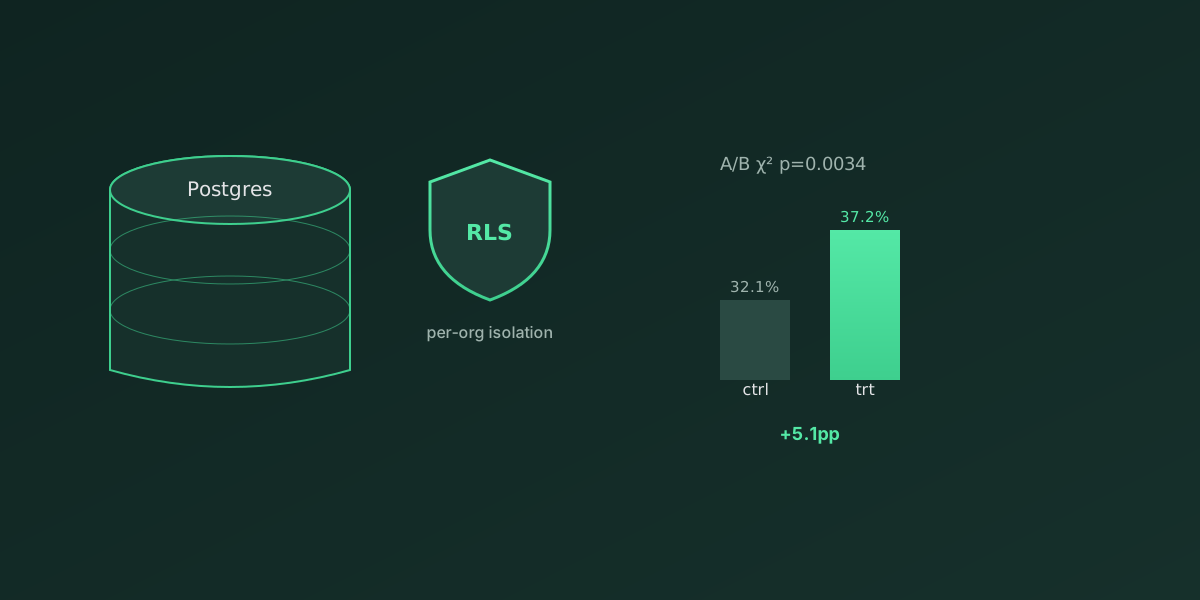
Full-stack product analytics platform — a Streamlit dashboard reading live Supabase Postgres through Row Level Security, plus an Edge Function ingest API and a concluded A/B experiment with SQL-computed conversion and a chi-square significance test.
PythonStreamlitSupabase (Postgres + RLS + Edge Functions)SQLsupabase-py
Impact: Full-stack: Streamlit UI + Supabase Postgres + Edge Function ingest (API-key auth), Row Level Security on every table — a user sees only their org's rows, SQL views compute funnel, cohort, MRR, DAU, channel conversion — the dashboard reshapes, it does not aggregate, A/B result in the DB: control 32.1% vs treatment 37.2%, p = 0.0034 (chi-square)
Repo is private — available on request
TaskFlow — PostHog Product Analytics Pipeline
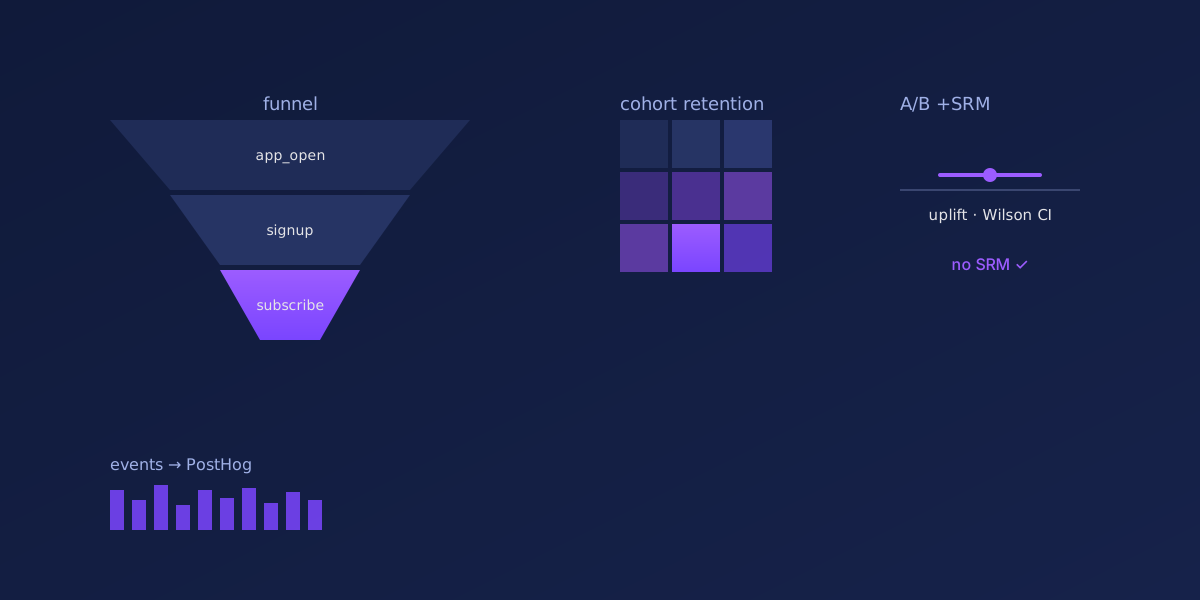
End-to-end portfolio project — instrument a SaaS product with PostHog, generate realistic traffic, and analyze the events into a funnel, cohort retention, an A/B test, revenue/LTV, and time-to-convert, all in Python.
PythonPostHogFastAPIStreamlitpandas / matplotlibpytest / ruffDocker
Impact: Typed event catalog (single source of truth) + PostHog capture/identify/group with PII scrubbing, Feature flag → onboarding A/B variant; A/B analysis with chi-square, uplift, Wilson CI + SRM check, Day-N cohort retention, time-to-convert, revenue/LTV, first-feature → upgrade conversion, The same metrics as SQL (BI / interview reference) + interactive Streamlit dashboard, CI (pytest + ruff) + Docker + render.yaml for one-click deploy
Repo is private — available on request
Product Analytics Dashboard (Streamlit)
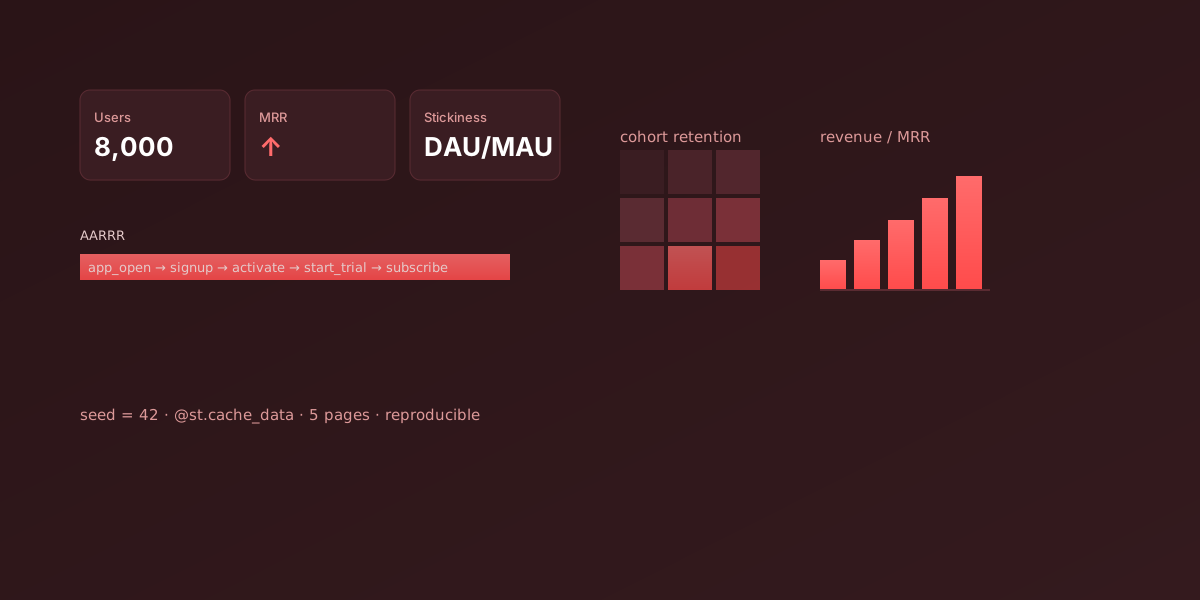
A self-contained product analytics dashboard on a synthetic SaaS dataset (8,000 users). Covers the AARRR funnel, cohort retention, revenue, and user segmentation.
PythonStreamlitpandas / NumPy
Impact: 8,000 synthetic users, Jan 2024 – Jun 2025, deterministic seed = 42, AARRR funnel: app_open → signup → activate → start_trial → subscribe with step drop-off, Cohort retention heatmap (signup month × months since signup), Revenue: MRR growth, MRR by plan, ARPU, logo churn, Segments: distributions + conversion + ARPU by segment / channel / country / device
Repo is private — available on request
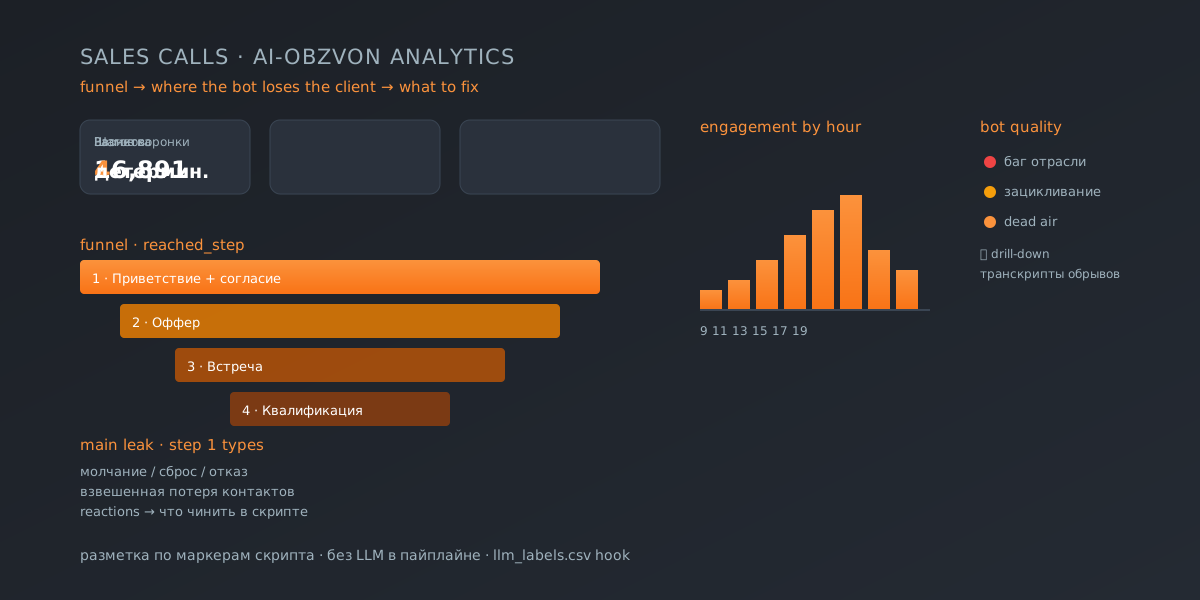
Sales Calls Analytics Dashboard
Streamlit dashboard for AI sales-call analytics — a 4-step funnel (greeting → offer → meeting → qualification), step-1 leak breakdown by type, weighted contact loss, client reactions, engagement by hour and day, bot-quality defects, and drill-down into drop-off transcripts.
PythonStreamlitpandas
Impact: 16,891 synthetic calls, deterministic labeling (script markers), 4-step funnel: greeting → offer → meeting → qualification, Main leak broken down by type (silence / hang-up / refusal) + weighted contact loss, Engagement by hour and weekday — when to call, LLM labeling hook (llm_labels.csv) — the pipeline is reproducible without it
SQL Analytics Case Study
Ten end-to-end SQL case studies on a synthetic product dataset (~183k events), runnable on DuckDB with one command. Funnel, N-day retention, DAU/MAU stickiness, LTV, gaps-and-islands streaks, A/B conversion, and revenue attribution.
SQLDuckDBPythonpandas / NumPypytest
Impact: 10 self-contained SQL cases (funnel → attribution), DuckDB — no server, no credentials, one command, Regression tests with deterministic invariants per case, Synthetic deterministic data (seed=42, ~183k events)
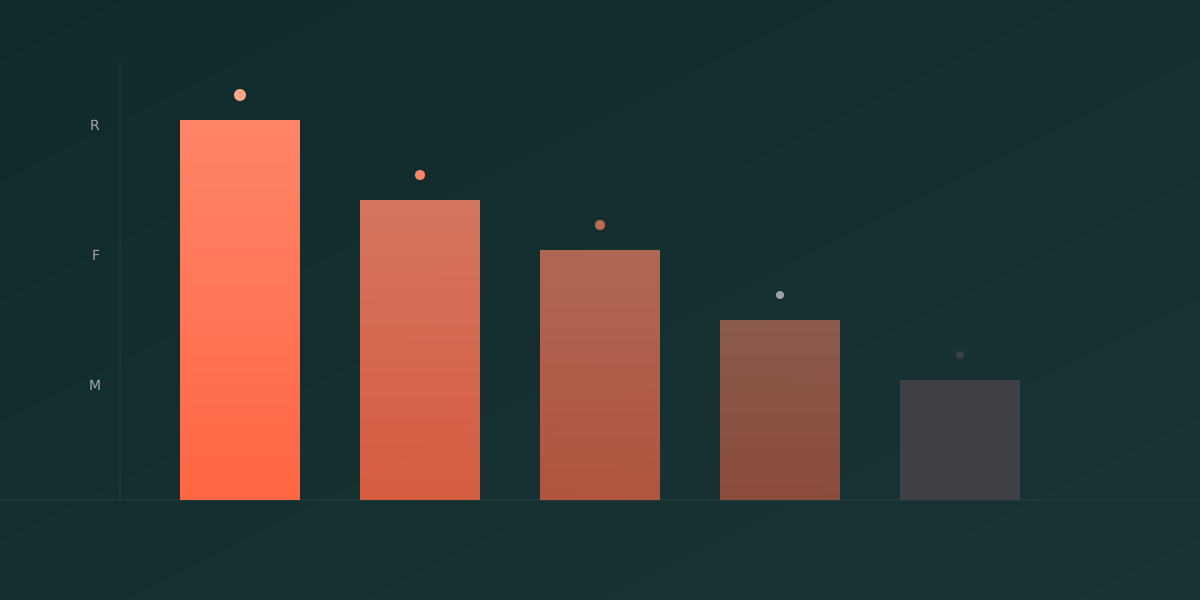
RFM Analysis of Bank Clients
RFM analysis of bank clients to segment users by Recency, Frequency, and Monetary metrics. Surfaced key customer groups, optimized marketing campaigns, and improved retention efficiency.
PythonSQLTableau
Impact: Identified high-value customer segments, Optimized marketing campaigns, Improved retention efficiency
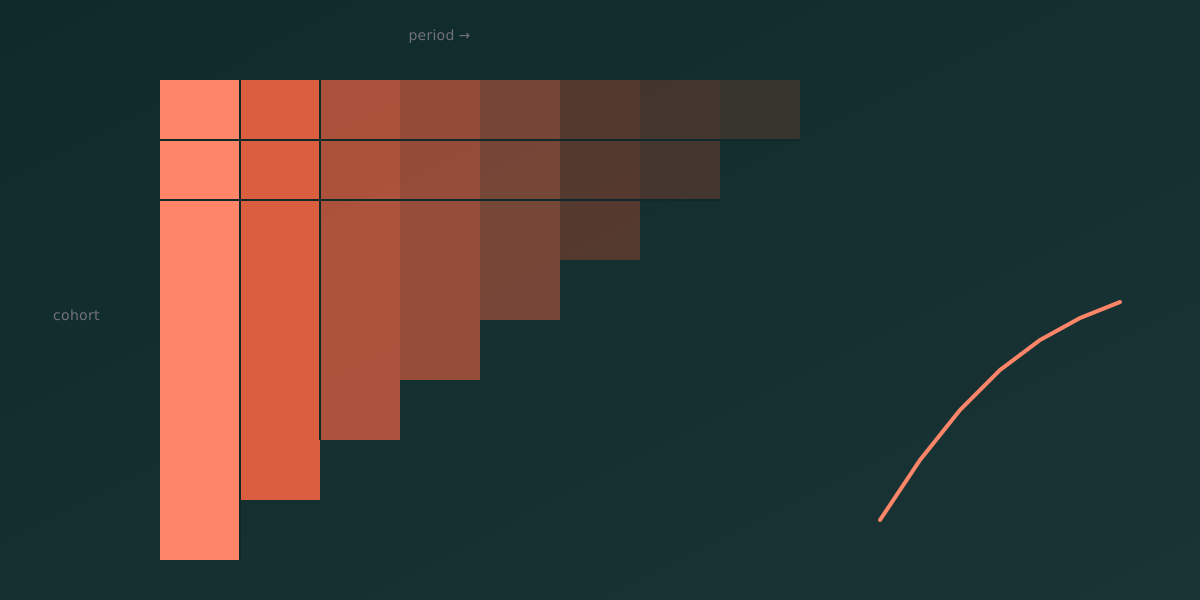
Cohort Analysis Dashboard
Cohort retention and LTV analysis on synthetic data — retention curves, churn patterns, and revenue/LTV by acquisition cohort. Python pipeline (pandas + matplotlib/seaborn) plus a Tableau-ready export with CSV and Hyper extract.
Pythonpandasmatplotlib / seabornJupyter NotebookTableau (Hyper API)
Impact: Cohort retention matrix with triangular decay, ARPU / LTV by cohort with proper observation-age caveat, Tableau-ready export (CSV + .hyper extract), Reproducible seeded pipeline (seed=42)
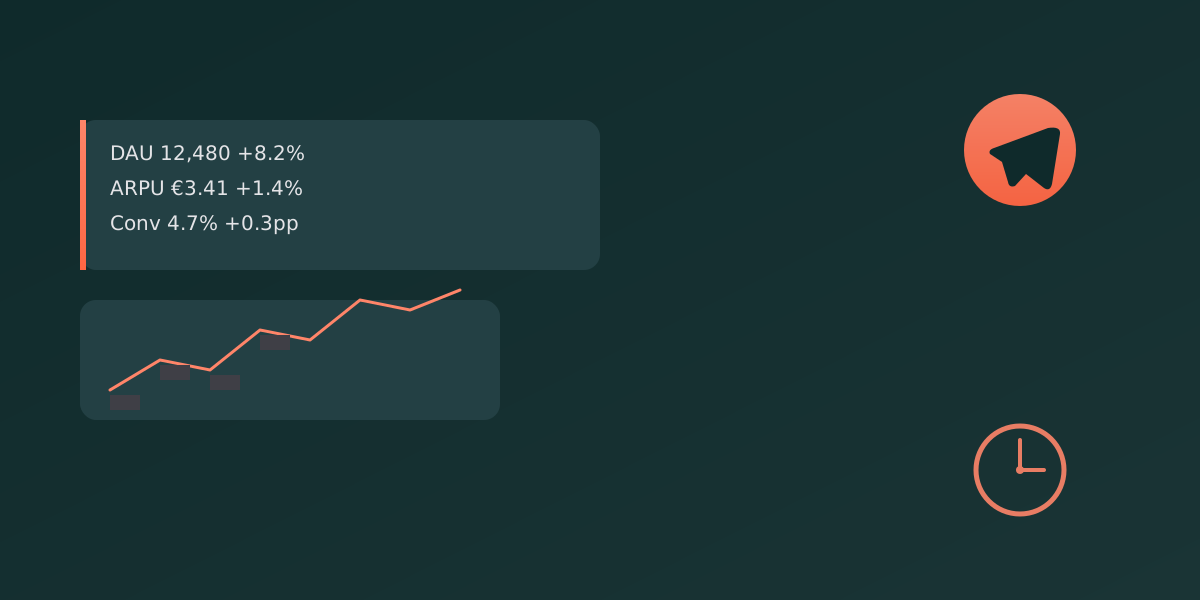
Reporting Automation Telegram Bot
A Telegram bot that automates weekly reporting and integrates with external APIs. Cuts time on routine tasks, ensures timely delivery of key metrics, and improves team communication.
Pythonaiogram / telegram-botSQLcron schedulerTableau
Impact: Cut weekly report prep from 1–2h to automated cron, KPI table + sparklines delivered on schedule, Fallback notifications on source failures, Single consolidated pipeline replacing fragmented sources

Scrolly English Speaking
A scrollytelling guide for improving spoken English in workplace conversations (A2–B1) — built on Astro 6 with an MDX narrative and D3 visualizations. Content and visuals are decoupled: MDX holds the text, data modules hold section structure and viz props.
AstroTypeScriptMDXD3Tailwind v4
Impact: Scrollytelling narrative on Astro 6 + MDX, D3 visualizations (workflow, bars, calendar, checklist), Content and visuals decoupled — trusted data module, frontmatter safely merged on top, Interactive viz panels via IntersectionObserver + dark/light theme + reduced-motion, Deployed to GitHub Pages subpath, Node 22, `astro check` in CI

Digital Garden
A personal digital garden and Zettelkasten published as a website with Quartz v4 — linked notes, backlinks, graph view, and atomic evergreen notes instead of chronological blog posts.
TypeScriptQuartz v4MarkdownObsidian
Impact: Linked-notes Zettelkasten with backlinks + graph view, Atomic evergreen notes over chronological posts, Quartz v4 — TypeScript-extensible, static output, Obsidian-flavored Markdown → public site
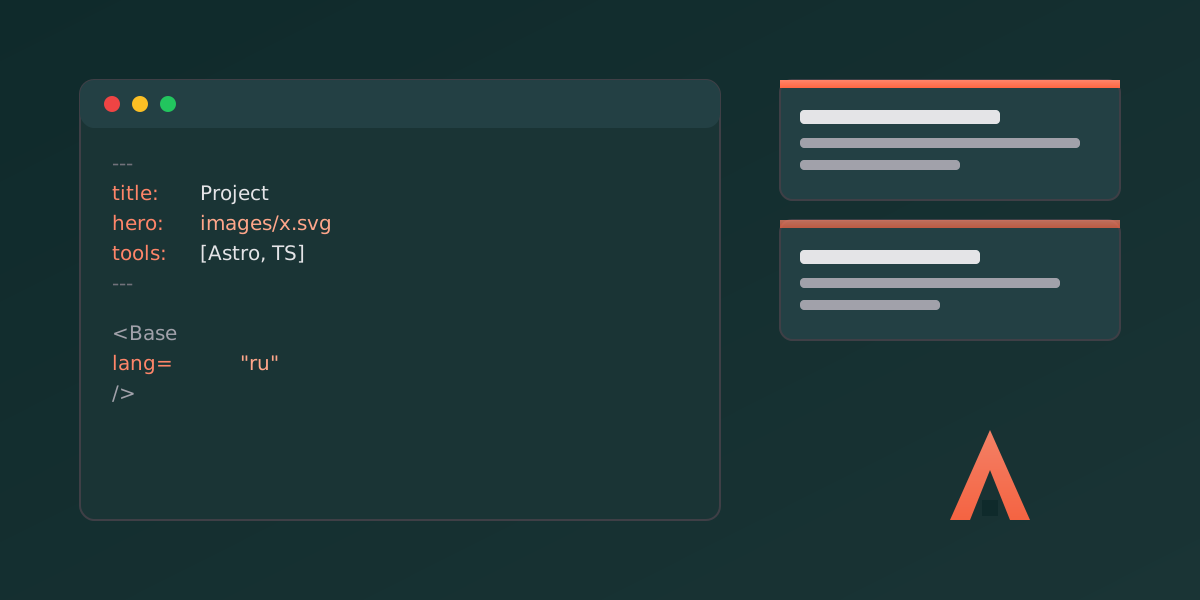
This Portfolio Site
The portfolio you are looking at — built with Astro v5, TypeScript, and Markdown content collections. Static output, dark/light theme, RSS, sitemap, JSON-LD, and a base-path-aware URL helper for GitHub Pages.
AstroTypeScriptMarkdownCSS custom properties
Impact: Astro v5 + TypeScript + Markdown content collections, Dark/light theme with no-flash inline script, RSS, sitemap, robots, JSON-LD, OG/Twitter meta, Base-path-aware URLs for GitHub Pages subpath hosting