Product Analytics Dashboard (Streamlit)
Business Context
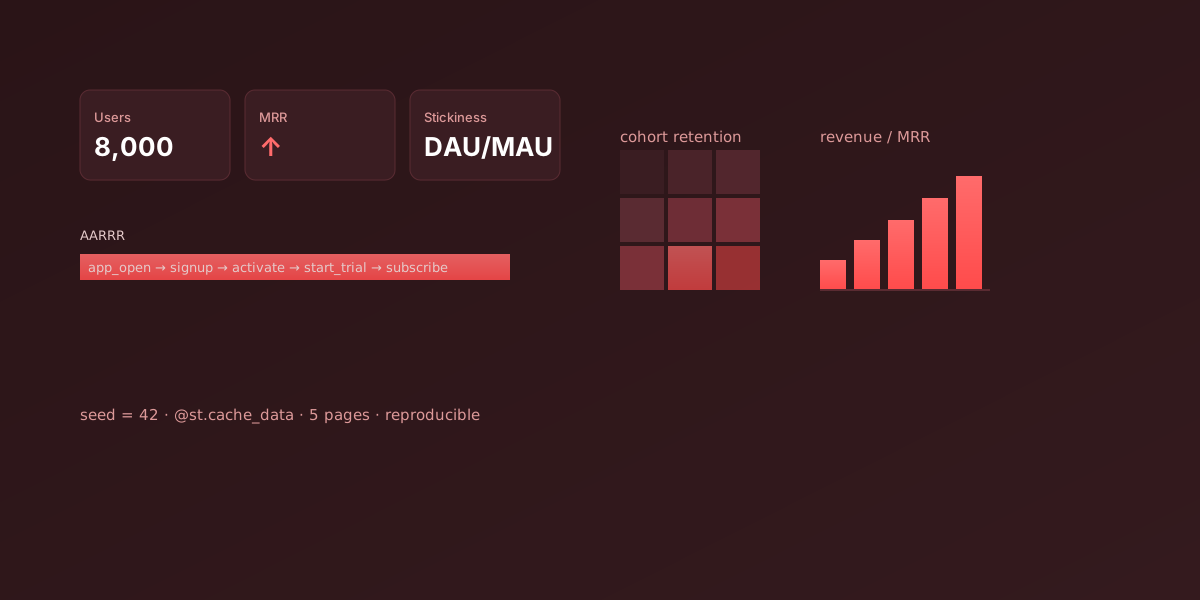
An analytics portfolio should show the whole AARRR cycle on one consistent dataset, not one metric in isolation. This dashboard is a self-contained app: data is generated deterministically, and the metrics reproduce across runs.
Pages
| Page | What it shows |
|---|---|
| Overview | KPIs (users, paid, MRR, active 30d, stickiness), DAU trend, monthly signups, conversion by channel |
| Funnel | app_open → signup → activate → start_trial → subscribe with step drop-off |
| Retention | Cohort retention heatmap (signup month × months since signup) |
| Revenue | MRR growth, MRR by plan, ARPU, logo churn |
| Segments | Distributions + conversion + ARPU by segment / channel / country / device |
Data & Method
Data: a synthetic SaaS dataset, 8,000 users, Jan 2024 – Jun 2025. Generated in-memory with a deterministic seed = 42 and cached via @st.cache_data — the dataset is identical across runs and shared across pages within a session.
Run:
uv sync
uv run streamlit run app.py
Insight
One consistent base for every AARRR question is the whole point. The deterministic seed means Funnel, Retention, Revenue, and Segments all talk about the same users, and the numbers can be checked. The same UI later became the presentation layer for the Supabase full-stack project — only the data layer changed.
Impact
- Full AARRR — 5 pages on one 8,000-user dataset.
- Reproducibility — deterministic seed = 42,
@st.cache_data. - UI reuse — the presentation layer carried over to the Supabase project.
- Self-contained — no external data dependencies, runs in one command.