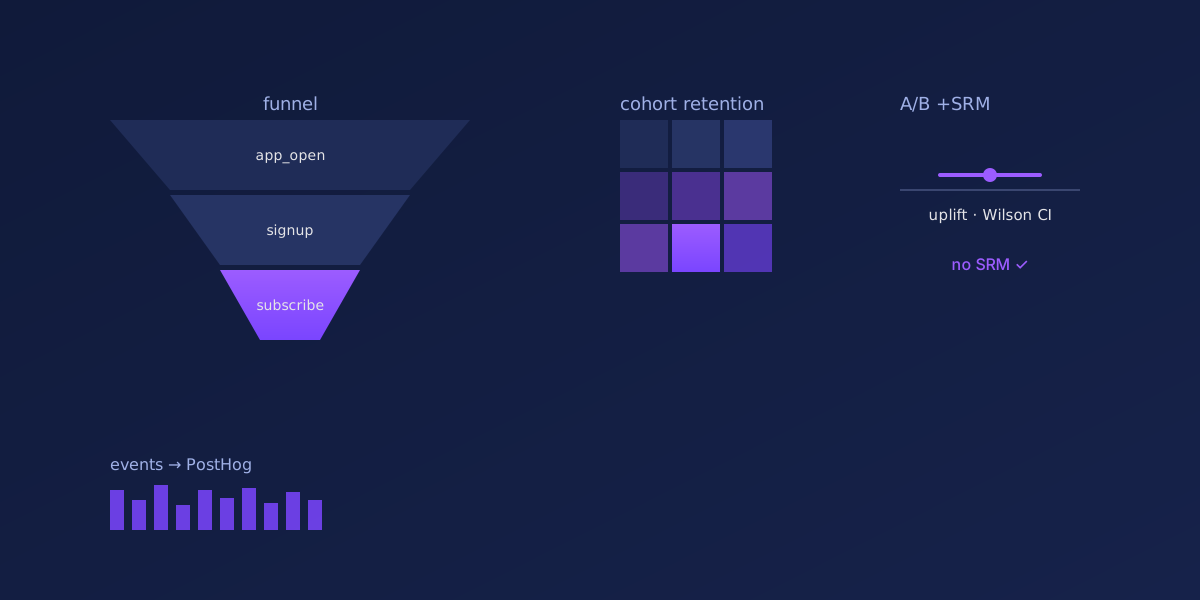
TaskFlow — PostHog Product Analytics Pipeline
Business Context
Most analytics portfolios start with a ready-made CSV. This project starts earlier — with instrumenting an application — and goes through the whole cycle: generate traffic, capture events, analyze, dashboard, and deploy.
Pipeline
app/                Demo SaaS (FastAPI + Jinja2): routes + server-side capture
  analytics/        typed event catalog · PostHog wrapper (PII scrub) · feature flag
scripts/            simulate_events.py — 30 days of realistic funnel traffic
analysis/           funnel · cohort · A/B · revenue/LTV · time-to-convert · feature-usage · SQL
dashboard/          interactive Streamlit dashboard
What it demonstrates
- Instrumentation: a typed event catalog as the single source of truth; server-side capture; PII scrubbing.
- A/B: feature flag → onboarding variant; chi-square, uplift, Wilson CI, SRM check.
- Metrics: funnel, Day-N cohort retention, time-to-convert, revenue/LTV, first-feature → upgrade.
- SQL mirror: the same metrics as SQL — a reference for BI and interviews.
- Engineering: pytest + ruff in CI, Dockerfile, render.yaml for one-click deploy.
Insight
The value is in the completeness of the cycle. The typed event catalog and PII scrubbing are the discipline that separates production instrumentation from a demo: events are defined in one place, PII does not leak, and the metrics reproduce in both Python and SQL.
Impact
- Full lifecycle — instrument → generate → analyze → dashboard → deploy in one repo.
- 7 analyses — funnel, cohort, A/B, revenue/LTV, time-to-convert, feature-usage, SQL mirror.
- A/B with SRM check — chi-square + uplift + Wilson CI.
- Production-ready — CI, Docker, render.yaml.