Product Analytics + A/B on Supabase
Business Context
Most analytics portfolios show metrics on a clean CSV. This project closes a different gap — how analytics embeds into a real multi-tenant product: auth, per-org data isolation, an event ingest path, and an experiment whose result is computed in the database, not in a notebook.
Architecture
Client/seed  ── POST /functions/v1/ingest (x-api-key) ──►  Edge Function (Deno)
                                                              │
Streamlit    ◄── email/password auth + SQL (RLS-scoped) ──►  Supabase Postgres
dashboard (supabase-py, anon key) analytics + experiments- Schemas:
analytics(organizations, api_keys, users, events, subscriptions, org_members) andexperiments(experiments, variants, assignments, metrics). - Analytics in the DB: SQL views compute funnel, cohort retention, MRR, DAU, and channel conversion (
sql/002_views.sql) — the dashboard reshapes, it does not aggregate. - A/B in the DB:
experiments.v_resultscomputes per-variant assigned/converted/conversion; the chi-square test runs on top in the dashboard. - Ingest: the Edge Function validates an API key (SHA-256 hash, never plaintext) and inserts the event via a
security definerfunction.
Security model (RLS)
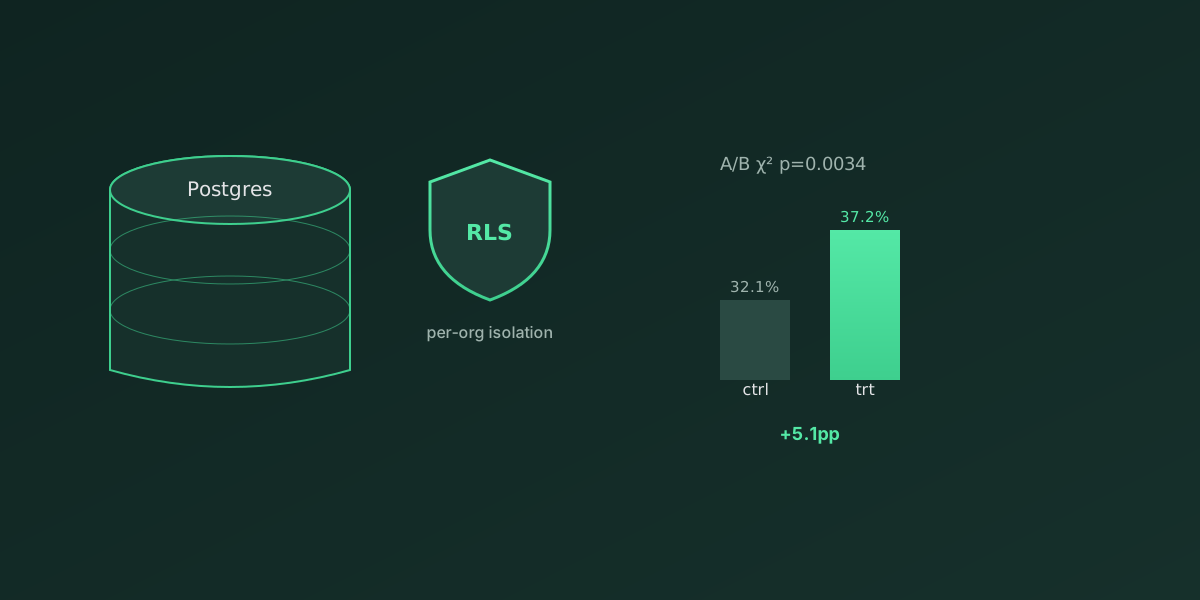
Every table has Row Level Security enabled. A user only ever sees rows of their organization — the dashboard is safe to expose to real users, not just to run locally.
Insight
The key point: analytics is computed where the data lives. SQL views and v_results mean metrics and experiment results are consistent across any client that connects to the database — dashboard, BI tool, or ad-hoc SQL all see the same numbers.
Impact
- Full-stack path — instrument → ingest → isolate → analyze → experiment in one repo.
- Concluded A/B — control 32.1% vs treatment 37.2%, p = 0.0034 (chi-square), +5.1pp lift.
- RLS on every table — the dashboard is safe to expose to real users.
- Reused UI — the presentation layer is taken from streamlit-app; only the data layer changed.