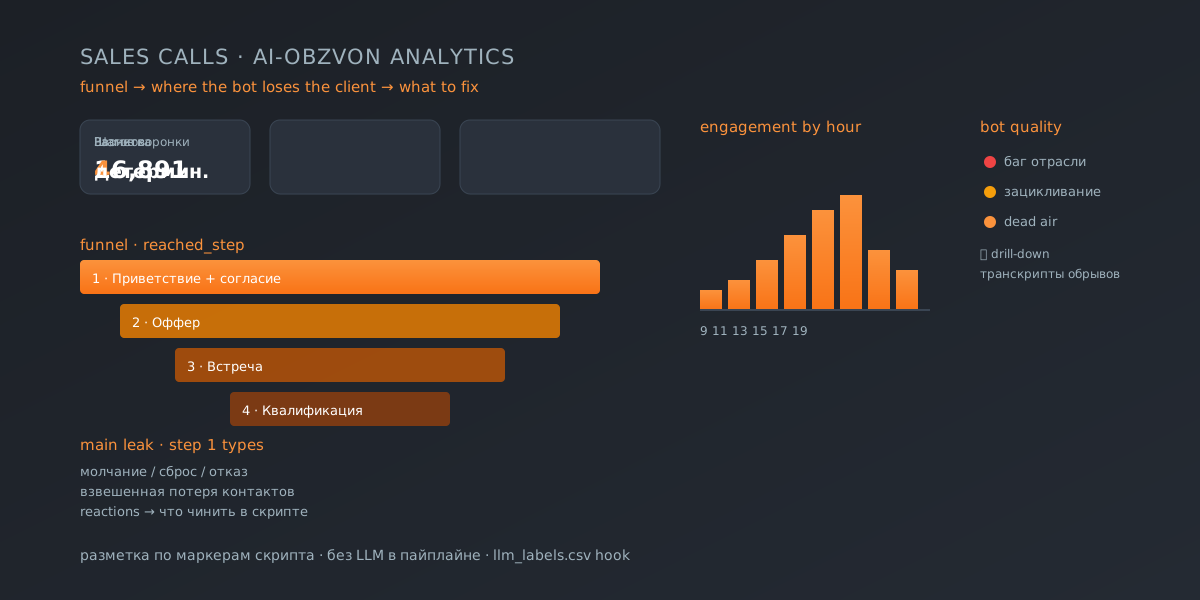
Sales Calls Analytics Dashboard
Business Context
An AI call flow is a funnel: greeting → offer → meeting → qualification. The production export stores the calls but does not say which step the bot loses the client on. The goal is to turn the raw export into an answer in a minute: where the drop-off is, for what reasons, when to call, and what to fix.
What the dashboard shows
| Block | What it answers |
|---|---|
| KPI + funnel | overall picture and where the main break is |
| Step-1 breakdown | the main leak by type: silence / hang-up / refusal |
| Where to focus | funnel transitions by weighted contact loss |
| Client reactions | what to fix in the script from the engaged tail |
| When to call | engagement by hour and weekday |
| Bot quality | ready-made defects: industry bug, looping, dead air |
| Dialog drill-down | filter a slice + read drop-off transcripts |
Labeling methodology
The bot script is templated, so the step a conversation reached is determined deterministically from markers in the bot’s replies:
- 1 — greeting + consent;
- 2 — offer;
- 3 — meeting;
- 4 — qualification.
The step-1 drop reason and the client reaction type are text heuristics. No LLM is used in the pipeline (everything is reproducible), but if an llm_labels.csv with phone, dt_raw, <labels> columns is placed alongside, the labels are merged automatically — reaction labeling can be strengthened via an LLM.
Data
The data/calls_demo.csv dataset is fully synthetic: generated by make_demo_data.py, deterministic on a fixed SEED, and contains no real phone numbers, names, or recordings. The numbers reproduce the shape of a typical production export (funnel, defects, hourly distribution) so the dashboard tells a realistic story on safe data.
Run
python3 -m venv .venv
.venv/bin/pip install -r requirements.txt
.venv/bin/streamlit run app.py
Impact
- A minute to an answer — which step loses the client and what to fix.
- Deterministic labeling — reproducible, no LLM in the critical path.
- A growth point — weighted contact loss and a first A/B scenario.
- Safe demo — synthetic data, free public deployment.