RFM Analysis of Bank Clients
Business Context
The bank accumulates client transaction data, but marketing campaigns ran “flat”: the same offer for everyone. The task is to split the client base into homogeneous segments to personalize communication and concentrate resources on the most valuable clients.
Hypothesis
If we segment clients along three dimensions — Recency (when the last purchase happened), Frequency (operation count), and Monetary (total revenue) — we can surface groups with distinct behavior and build a separate retention and growth strategy for each.
Data & Method
Data: client transaction history, including operation date, amount, and transaction type.
Analysis steps:
- Cleaning & preparation — duplicates removed, missing values handled, relevant operation types selected.
- RFM metric calculation per client:
- Recency: days since last transaction
- Frequency: number of operations over the period
- Monetary: total revenue from the client
- RFM-score clustering — each dimension scored, clients grouped into segments.
- Segment distribution visualization in Tableau with time and product filters.
Tools: Python (Pandas, Scikit-learn), SQL, Tableau.
Insight
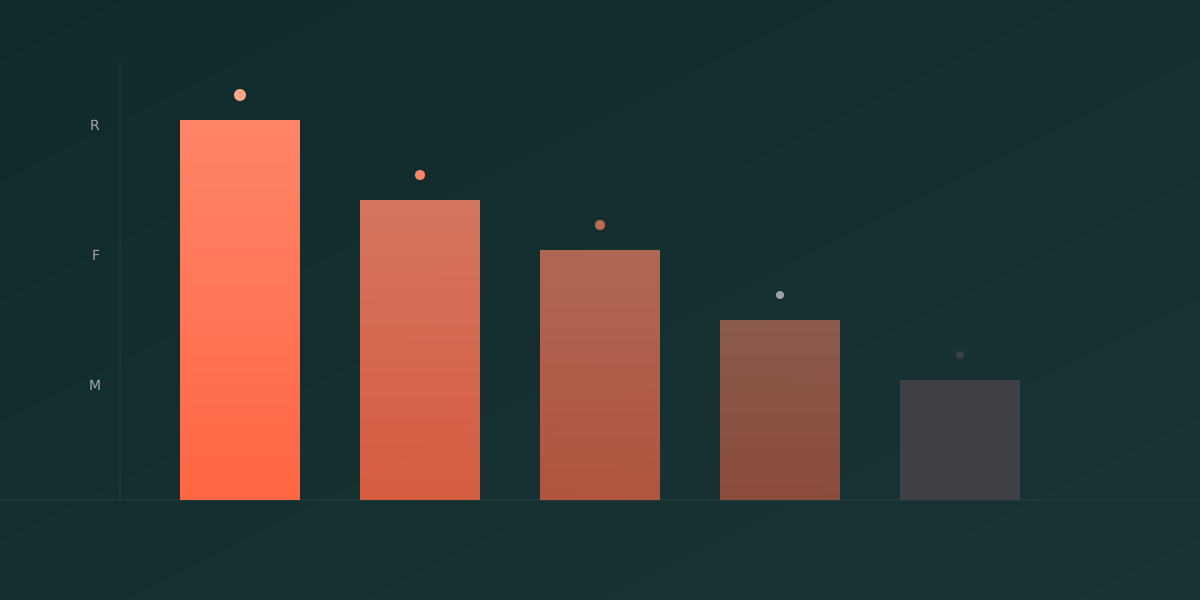
Four key groups emerged:
- High-value customers — recent, frequent, high-revenue clients. The main contribution to revenue.
- Medium-value customers — moderate activity and revenue. Upsell growth potential.
- Low-value customers — rare and low-revenue. Inefficient to invest in expensive channels.
- At-risk customers — previously active but long inactive. Need reactivation.
Key insight: a small share of high-value clients generates a disproportionate share of revenue, while the at-risk segment decays faster than new-client inflow grows.
Impact
- High-value segments identified — marketing got clear personas for targeting.
- Campaigns optimized — budget reallocated toward high-value retention and at-risk reactivation.
- Retention efficiency improved — teams moved from mass mailings to segmented scenarios.