The same metrics as SQL (BI / interview reference) + interactive Streamlit dashboard
CI (pytest + ruff) + Docker + render.yaml for one-click deploy
Source
View on GitHub →
Repo is private — available on requestUpdated: Sep 15, 2026
TaskFlow — PostHog Product Analytics Pipeline
Context
Most analytics portfolios start with a ready-made CSV. This project starts earlier — with instrumenting an application — and goes through the whole cycle: generate traffic, capture events, analyze, dashboard, and deploy.
SQL mirror: the same metrics as SQL — a reference for BI and interviews.
Engineering: pytest + ruff in CI, Dockerfile, render.yaml for one-click deploy.
Findings
The value is in the completeness of the cycle. The typed event catalog and PII scrubbing are the discipline that separates production instrumentation from a demo: events are defined in one place, PII does not leak, and the metrics reproduce in both Python and SQL.
Impact
Full lifecycle — instrument → generate → analyze → dashboard → deploy in one repo.
Product analytics is usually shown on a cleaned CSV. The hard part — instrumenting a real app, capturing the right events without PII leaks, getting them into a tool, and turning raw events into decisions — stays invisible.
Approach
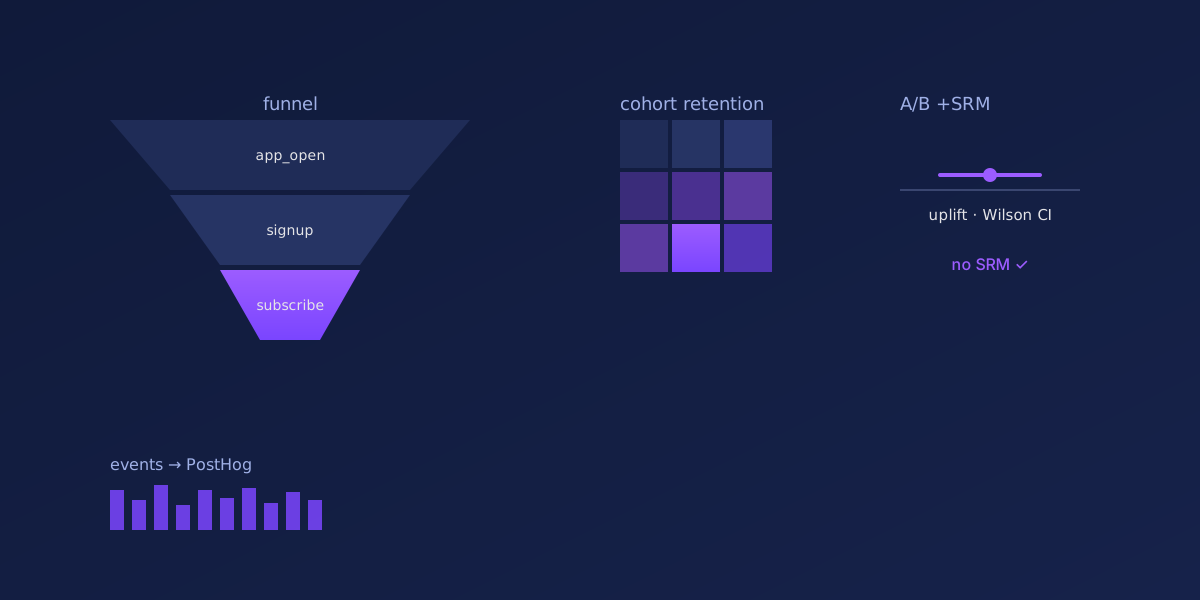
Built a demo SaaS (FastAPI + Jinja2) with server-side PostHog capture over a typed event catalog (single source of truth), a PostHog wrapper that scrubs PII, and a feature flag driving an onboarding A/B. A simulator generates 30 days of realistic funnel traffic; analysis scripts turn the pulled events into funnel, cohort retention, A/B (chi-square + uplift + Wilson CI + SRM check), revenue/LTV, time-to-convert, and feature-usage → upgrade. The same metrics are written as SQL for BI/interview use, plus an interactive Streamlit dashboard.
Result
One repo covers the full analytics lifecycle — instrument, generate, analyze, dashboard, deploy — with CI (pytest + ruff), Docker, and render.yaml for one-click deploy. The typed event catalog and PII scrubbing show the discipline that separates a demo from production instrumentation.
7Analyses
yesA/B SRM-check
pytest + ruffCI
Docker + RenderDeploy
Charts
Source: github.com/NikitaBoyarkin/posthog-saas-analytics: data/raw/events.jsonl (committed snapshot, 14,764 events / 2,000 users) re-analyzed with `uv run python analysis/report.py` -> reports/posthog_analysis_report.md (funnel, retention, A/B, revenue); daily-active-users computed with pandas from data/raw/events.jsonl
Activation funnel
Sequential funnel: each step counts only users who performed it after the previous one. 32.8% of signups reach activation (core action) and 5.3% reach upgrade.
Key takeaways
The sharpest drop-off is at upgrade_completed: only 16.3% convert from the previous step, and just 107 of 2,000 users (5.3%) upgrade.
Onboarding loses 36.7% of users who completed signup (1,709 -> 1,082), and 60.6% of those who finish onboarding perform the core action.
Day-N cohort retention (D0–D6)
Cohort = signup day; retained = share of the cohort that fired core_action_performed on day N. Shown are the 14 most recent cohorts over the first 7 days; every value is real.
Key takeaways
Retention is low and jittery: D0 runs 32.7–41.8%, but by D1 it falls to 1.8–24.5% — users are active irregularly rather than daily.
The matrix is triangular from D4 onward: cohorts 2026-09-13 (D1 = 1.8%) and 2026-09-14 (D1 = 3.9%) show the weakest retention among the newest cohorts.
Onboarding A/B test: control vs new_onboarding
Shorter onboarding vs control, measured by completion among users who started. Completion is 55.9% for control vs 70.8% for new_onboarding.
Key takeaways
Relative uplift in completion is +26.6% (55.9% -> 70.8%), chi-square 40.10, p = 0.0000 — the effect is statistically significant.
The 95% CI for the difference (new - control) is [8.4, 21.2] pp, and the sample-ratio-mismatch check passes (p = 0.9037): the split is balanced, so the variant can be rolled out.
Daily active users (DAU)
Unique users per day across the 30-day traffic snapshot. The final days (2026-09-14, 2026-09-15) are the tail of the simulation window with partial days.
Key takeaways
DAU grew from 69 (2026-08-16) to a peak of 284 (2026-09-12) — a 4.1x increase over the 30-day window.
Growth is steady, with a median day-over-day change of +8%; the final values of 70 (2026-09-14) and 4 (2026-09-15) are a partial-day tail of the simulation.