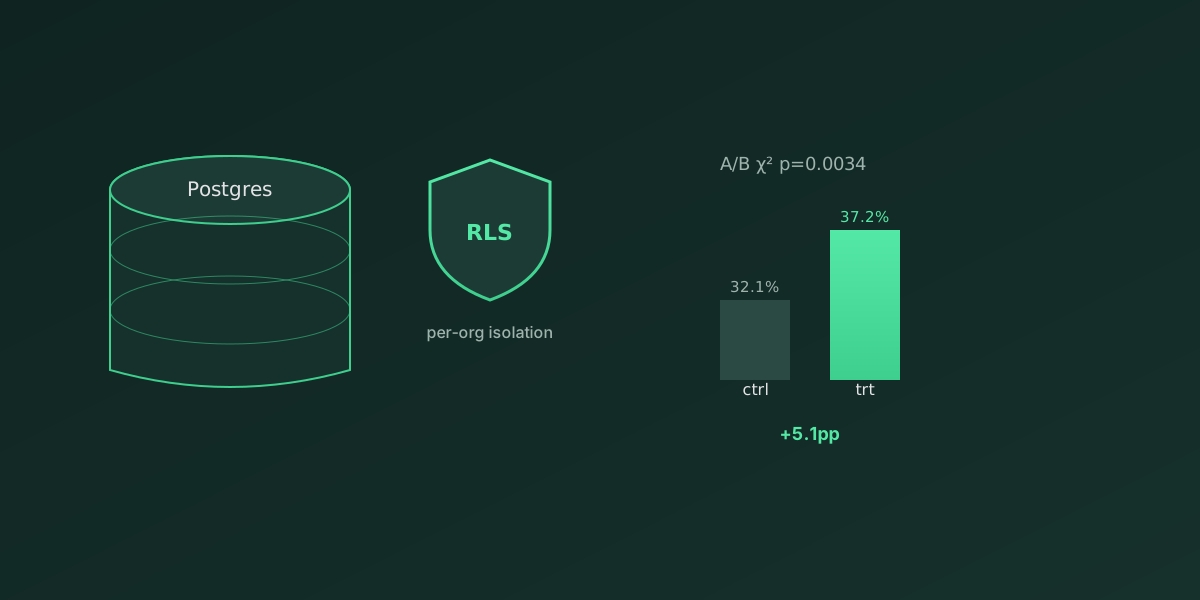
Product Analytics + A/B on Supabase
▶ Architecture diagram — self-contained HTML, opens in a browser — no install, no build
Situation
Most analytics portfolios show metrics on a clean CSV. The hard part stays invisible: how analytics embeds into a real multi-tenant product — auth, per-org data isolation, an event ingest path, and an experiment whose result is computed in the database, not in a notebook.
Task
I needed to show analytics living inside a real product rather than beside one, so I owned the multi-tenant setup: auth, per-organization isolation, the event ingest path, and the experiment result computed in the database.
Actions
Architecture
Client/seed  ── POST /functions/v1/ingest (x-api-key) ──►  Edge Function (Deno)
                                                              │
Streamlit    ◄── email/password auth + SQL (RLS-scoped) ──►  Supabase Postgres
dashboard (supabase-py, anon key) analytics + experiments- Schemas:
analytics(organizations, api_keys, users, events, subscriptions, org_members) andexperiments(experiments, variants, assignments, metrics). - Analytics in the DB: SQL views compute funnel, cohort retention, MRR, DAU, and channel conversion (
sql/002_views.sql) — the dashboard reshapes, it does not aggregate. - A/B in the DB:
experiments.v_resultscomputes per-variant assigned/converted/conversion; the chi-square test runs on top in the dashboard. - Ingest: the Edge Function validates an API key (SHA-256 hash, never plaintext) and inserts the event via a
security definerfunction.
Security model (RLS)
Every table has Row Level Security enabled. A user only ever sees rows of their organization — the dashboard is safe to expose to real users, not just to run locally.
Result
Analytics is computed where the data lives: SQL views and v_results mean metrics and experiment results are consistent across any client that connects to the database — dashboard, BI tool, or ad-hoc SQL all see the same numbers. The concluded A/B shows control 29.6% vs treatment 40.7%, +11.1pp at p ≈ 1.7e-10 (χ²).
Limitations
The A/B events are seeded, so the value is not the effect size itself but the fact that the experiment is computed in the database, isolated per tenant, and reproducible by any client. There is no product story behind the numbers — this demonstrates architecture, not a real launch result.