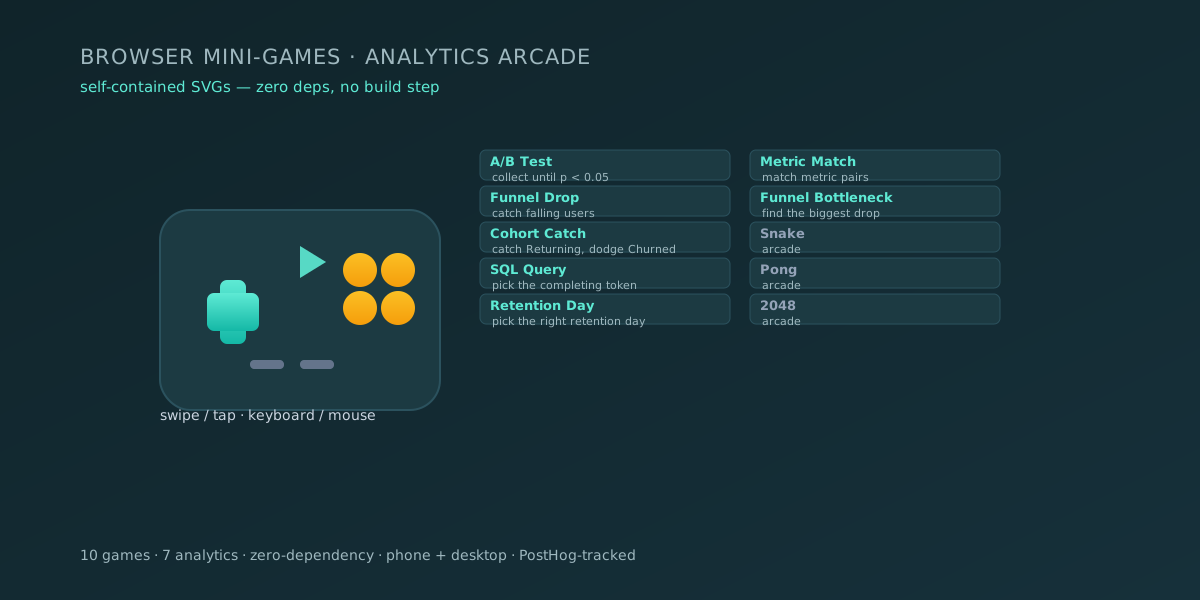
Browser Mini-Games — Analytics Arcade
▶ Architecture diagram — self-contained HTML, opens in a browser — no install, no build
Situation
Analytics concepts — p-values, retention, funnels — are abstract: a recruiter or student can’t ‘feel’ them from text, and passive dashboards don’t provide an interactive experience. Mini-games turn concepts into mechanics: you play, and you understand why p < 0.05 matters, what a retention day is, and where the funnel bottleneck sits.
Task
I needed statistical ideas to be learned by playing rather than by reading, so I owned the mini-games that turn p-values, retention days, and funnels into mechanics the player has to work through.
Actions
Games
| Game | Type | Mechanic |
|---|---|---|
| 🐍 Snake | arcade | eat, grow, don’t crash |
| 🏓 Pong | arcade | beat the CPU — first to 11 |
| 🔢 2048 | arcade | merge tiles to reach 2048 |
| 🧪 A/B Test | analytics | collect data until p < 0.05 |
| 🔻 Funnel Drop | analytics | catch falling users, convert |
| 📊 Cohort Catch | analytics | catch Returning, dodge Churned |
| 🧩 SQL Query | analytics | pick the token that completes the SQL |
| 🃏 Metric Match | analytics | match metric pairs in fewest moves |
| 📅 Retention Day | analytics | pick the right retention day |
| 🔍 Funnel Bottleneck | analytics | find the biggest funnel drop |
Architecture
Each game is a self-contained SVG: HTML, CSS and JS in one file. One file = the whole game, zero-dependency, no build step. The hub is Astro (static), deployed to GitHub Pages. Dark/light/cyberpunk themes via data-theme + localStorage.
Analytics & Conversion
game_selected— PostHog event on game pick.- In-game CTA → contact (Telegram deep-link),
contact_clickevent. - Portfolio sync:
sync_games.pycopiesdist/→public/games/(drift check via--check).
Testing
Playwright smoke tests (pytest): each game loads from public/ and is checked for functionality.
Run
npm install
npm run dev          # dev server
npm run build        # production build → dist/
python3 sync_games.py --dry-run   # preview sync to portfolio
Result
10 games work on phone (swipe/tap) and desktop (keyboard/mouse), open from a single file with no server. Analytics games are a learning tool: concept → mechanic → intuition. Portfolio sync is automatic, and Playwright smoke tests catch load failures.
Limitations
The games simplify statistics into intuition and do not replace real analysis: the mechanic shows the idea of a p-value or retention, not a valid computation. Zero-dependency means one file per game — code is not shared across games, so any change is made by hand in each file.