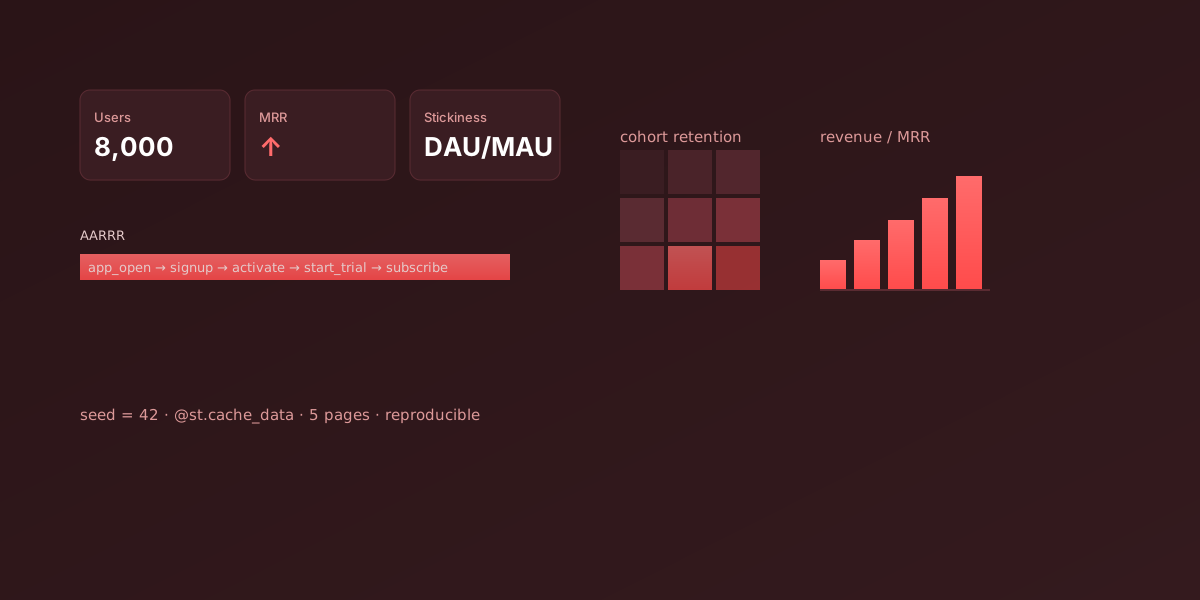
← Back to portfolio Product Analytics Dashboard (Streamlit) preview
Stack
PythonStreamlitpandas / NumPy
Impact
  • 8,000 synthetic users, Jan 2024 – Jun 2025, deterministic seed = 42
  • AARRR funnel: app_open → signup → activate → start_trial → subscribe with step drop-off
  • Cohort retention heatmap (signup month × months since signup)
  • Revenue: MRR growth, MRR by plan, ARPU, logo churn
  • Segments: distributions + conversion + ARPU by segment / channel / country / device
Source View on GitHub → Repo is private — available on request Updated: Aug 14, 2026

Product Analytics Dashboard (Streamlit)

Context

An analytics portfolio should show the whole AARRR cycle on one consistent dataset, not one metric in isolation. This dashboard is a self-contained app: data is generated deterministically, and the metrics reproduce across runs.

Data & Method

Data: a synthetic SaaS dataset, 8,000 users, Jan 2024 – Jun 2025. Generated in-memory with a deterministic seed = 42 and cached via @st.cache_data — the dataset is identical across runs and shared across pages within a session.

Pages

Page What it shows
Overview KPIs (users, paid, MRR, active 30d, stickiness), DAU trend, monthly signups, conversion by channel
Funnel app_open → signup → activate → start_trial → subscribe with step drop-off
Retention Cohort retention heatmap (signup month × months since signup)
Revenue MRR growth, MRR by plan, ARPU, logo churn
Segments Distributions + conversion + ARPU by segment / channel / country / device

Run

uv sync
uv run streamlit run app.py

Findings

One consistent base for every AARRR question is the whole point. The deterministic seed means Funnel, Retention, Revenue, and Segments all talk about the same users, and the numbers can be checked. The same UI later became the presentation layer for the Supabase full-stack project — only the data layer changed.

Impact

  • Full AARRR — 5 pages on one 8,000-user dataset.
  • Reproducibility — deterministic seed = 42, @st.cache_data.
  • UI reuse — the presentation layer carried over to the Supabase project.
  • Self-contained — no external data dependencies, runs in one command.

Documentation

Case study

Problem

Product analytics interviews expect reasoning across the whole AARRR frame — acquisition, activation, retention, revenue — but most portfolio pieces show one metric in isolation.

Approach

Built a multipage Streamlit dashboard on one synthetic SaaS dataset (8,000 users, deterministic seed = 42) shared across pages via @st.cache_data, so the dataset is identical across runs. Each page answers one AARRR question: Overview (KPIs, DAU, signups, channel conversion), Funnel (5-step drop-off), Retention (cohort heatmap), Revenue (MRR/ARPU/churn), Segments (conversion and ARPU by segment/channel/country/device).

Result

A single self-contained app lets a reviewer click through the full AARRR story on one consistent dataset. The deterministic seed makes the numbers reproducible, and the same UI was later reused as the presentation layer for the Supabase full-stack project — only the data layer changed.

8,000 Users
5 Pages
42 (deterministic) Seed
yes Reproducible

Charts

Source: github.com/NikitaBoyarkin/streamlit-app: data.py — deterministic synthetic SaaS dataset (seed=42; 8,000 users, 2024-01..2025-06); metrics computed by re-running the repo's own helpers (generate / funnel_counts / cohort_retention_matrix / mrr_series / conversion_by_channel) via `uv sync && uv run python data.py`

Activation & payment funnel

Unique users at each step: app_open → signup → activate → start_trial → subscribe. app_open and signup coincide by construction of the dataset.

app_open: 8000 (100% от макс.) app_open 8000 signup: 8000 (100% от макс.) signup 8000 activate: 5478 (68.5% от макс.) activate 5478 start_trial: 3025 (37.8% от макс.) start_trial 3025 subscribe: 1086 (13.6% от макс.) subscribe 1086
Key takeaways
  • Of 8,000 signups, 5,478 (68.5%) reach activation and 1,086 (13.6%) reach subscription.
  • The largest drop is start_trial→subscribe: 1,939 users are lost (64.1% of trialers); the step converts at 35.9%.

Cohort retention matrix

Share of active users by signup cohort (rows) and months since signup (columns, M0–M12). The matrix is triangular — younger cohorts have shorter observation history (trailing zeros). M0 is not 100% because activity is modeled separately from signup.

2024-01 2024-02 2024-03 2024-04 2024-05 2024-06 2024-07 2024-08 2024-09 2024-10 2024-11 2024-12 2025-01 2025-02 2025-03 2025-04 2025-05 2025-06 M0 M1 M2 M3 M4 M5 M6 M7 M8 M9 M10 M11 M12 2024-01 · M0: 88.9% 2024-01 · M1: 79.7% 2024-01 · M2: 59.9% 2024-01 · M3: 43.3% 2024-01 · M4: 34.8% 2024-01 · M5: 29.3% 2024-01 · M6: 22.8% 2024-01 · M7: 18.4% 2024-01 · M8: 13.8% 2024-01 · M9: 13.4% 2024-01 · M10: 9.4% 2024-01 · M11: 6.7% 2024-01 · M12: 6.7% 2024-02 · M0: 88.5% 2024-02 · M1: 80.1% 2024-02 · M2: 55.2% 2024-02 · M3: 44.4% 2024-02 · M4: 34.9% 2024-02 · M5: 28% 2024-02 · M6: 23.8% 2024-02 · M7: 15.7% 2024-02 · M8: 16.1% 2024-02 · M9: 11.3% 2024-02 · M10: 9.3% 2024-02 · M11: 8.4% 2024-02 · M12: 6.4% 2024-03 · M0: 89.7% 2024-03 · M1: 80.9% 2024-03 · M2: 59.3% 2024-03 · M3: 45.1% 2024-03 · M4: 33.3% 2024-03 · M5: 27.2% 2024-03 · M6: 18.7% 2024-03 · M7: 18.9% 2024-03 · M8: 13.8% 2024-03 · M9: 13.6% 2024-03 · M10: 10.3% 2024-03 · M11: 8.6% 2024-03 · M12: 8.6% 2024-04 · M0: 91.6% 2024-04 · M1: 79.3% 2024-04 · M2: 53.5% 2024-04 · M3: 39.8% 2024-04 · M4: 31.9% 2024-04 · M5: 24.9% 2024-04 · M6: 20% 2024-04 · M7: 18.8% 2024-04 · M8: 15.1% 2024-04 · M9: 11.2% 2024-04 · M10: 10% 2024-04 · M11: 8.6% 2024-04 · M12: 6.3% 2024-05 · M0: 91.2% 2024-05 · M1: 76.3% 2024-05 · M2: 54.5% 2024-05 · M3: 40.5% 2024-05 · M4: 28.7% 2024-05 · M5: 25% 2024-05 · M6: 19.4% 2024-05 · M7: 12.7% 2024-05 · M8: 11.2% 2024-05 · M9: 8% 2024-05 · M10: 8% 2024-05 · M11: 6.9% 2024-05 · M12: 3.9% 2024-06 · M0: 90.5% 2024-06 · M1: 80.9% 2024-06 · M2: 57.6% 2024-06 · M3: 46.4% 2024-06 · M4: 33% 2024-06 · M5: 27.9% 2024-06 · M6: 21.6% 2024-06 · M7: 16.8% 2024-06 · M8: 16.8% 2024-06 · M9: 12.2% 2024-06 · M10: 9.9% 2024-06 · M11: 9.9% 2024-06 · M12: 6.5% 2024-07 · M0: 89.5% 2024-07 · M1: 80.2% 2024-07 · M2: 57.4% 2024-07 · M3: 43.8% 2024-07 · M4: 36.4% 2024-07 · M5: 30.5% 2024-07 · M6: 23.1% 2024-07 · M7: 16.2% 2024-07 · M8: 11.4% 2024-07 · M9: 13.3% 2024-07 · M10: 8.3% 2024-07 · M11: 6.9% 2024-07 · M12: 0% 2024-08 · M0: 89.9% 2024-08 · M1: 82.4% 2024-08 · M2: 57.8% 2024-08 · M3: 41.7% 2024-08 · M4: 35.3% 2024-08 · M5: 29.7% 2024-08 · M6: 21.1% 2024-08 · M7: 16.3% 2024-08 · M8: 14% 2024-08 · M9: 10.5% 2024-08 · M10: 9% 2024-08 · M11: 0% 2024-08 · M12: 0% 2024-09 · M0: 90.2% 2024-09 · M1: 80.6% 2024-09 · M2: 60.3% 2024-09 · M3: 46.9% 2024-09 · M4: 36.2% 2024-09 · M5: 27.5% 2024-09 · M6: 20.5% 2024-09 · M7: 15.8% 2024-09 · M8: 14.1% 2024-09 · M9: 11.2% 2024-09 · M10: 0% 2024-09 · M11: 0% 2024-09 · M12: 0% 2024-10 · M0: 92.3% 2024-10 · M1: 79.5% 2024-10 · M2: 58.3% 2024-10 · M3: 41.1% 2024-10 · M4: 32.1% 2024-10 · M5: 26.8% 2024-10 · M6: 23% 2024-10 · M7: 18.1% 2024-10 · M8: 13% 2024-10 · M9: 0% 2024-10 · M10: 0% 2024-10 · M11: 0% 2024-10 · M12: 0% 2024-11 · M0: 91.3% 2024-11 · M1: 78% 2024-11 · M2: 56.7% 2024-11 · M3: 41.4% 2024-11 · M4: 31% 2024-11 · M5: 24.8% 2024-11 · M6: 22% 2024-11 · M7: 16.5% 2024-11 · M8: 0% 2024-11 · M9: 0% 2024-11 · M10: 0% 2024-11 · M11: 0% 2024-11 · M12: 0% 2024-12 · M0: 92% 2024-12 · M1: 78.4% 2024-12 · M2: 54.5% 2024-12 · M3: 44.4% 2024-12 · M4: 32.9% 2024-12 · M5: 26.5% 2024-12 · M6: 23.7% 2024-12 · M7: 0% 2024-12 · M8: 0% 2024-12 · M9: 0% 2024-12 · M10: 0% 2024-12 · M11: 0% 2024-12 · M12: 0% 2025-01 · M0: 87.8% 2025-01 · M1: 78.2% 2025-01 · M2: 58.5% 2025-01 · M3: 45.8% 2025-01 · M4: 36.9% 2025-01 · M5: 28.3% 2025-01 · M6: 0% 2025-01 · M7: 0% 2025-01 · M8: 0% 2025-01 · M9: 0% 2025-01 · M10: 0% 2025-01 · M11: 0% 2025-01 · M12: 0% 2025-02 · M0: 89.6% 2025-02 · M1: 78.5% 2025-02 · M2: 58.7% 2025-02 · M3: 48.3% 2025-02 · M4: 35.1% 2025-02 · M5: 0% 2025-02 · M6: 0% 2025-02 · M7: 0% 2025-02 · M8: 0% 2025-02 · M9: 0% 2025-02 · M10: 0% 2025-02 · M11: 0% 2025-02 · M12: 0% 2025-03 · M0: 91.4% 2025-03 · M1: 76.5% 2025-03 · M2: 58.1% 2025-03 · M3: 40.3% 2025-03 · M4: 0% 2025-03 · M5: 0% 2025-03 · M6: 0% 2025-03 · M7: 0% 2025-03 · M8: 0% 2025-03 · M9: 0% 2025-03 · M10: 0% 2025-03 · M11: 0% 2025-03 · M12: 0% 2025-04 · M0: 91.2% 2025-04 · M1: 77.8% 2025-04 · M2: 57.9% 2025-04 · M3: 0% 2025-04 · M4: 0% 2025-04 · M5: 0% 2025-04 · M6: 0% 2025-04 · M7: 0% 2025-04 · M8: 0% 2025-04 · M9: 0% 2025-04 · M10: 0% 2025-04 · M11: 0% 2025-04 · M12: 0% 2025-05 · M0: 90.8% 2025-05 · M1: 78.2% 2025-05 · M2: 0% 2025-05 · M3: 0% 2025-05 · M4: 0% 2025-05 · M5: 0% 2025-05 · M6: 0% 2025-05 · M7: 0% 2025-05 · M8: 0% 2025-05 · M9: 0% 2025-05 · M10: 0% 2025-05 · M11: 0% 2025-05 · M12: 0% 2025-06 · M0: 93.2% 2025-06 · M1: 0% 2025-06 · M2: 0% 2025-06 · M3: 0% 2025-06 · M4: 0% 2025-06 · M5: 0% 2025-06 · M6: 0% 2025-06 · M7: 0% 2025-06 · M8: 0% 2025-06 · M9: 0% 2025-06 · M10: 0% 2025-06 · M11: 0% 2025-06 · M12: 0% 0 100%
Key takeaways
  • After 1 month 76.3–82.4% of a cohort is still active; after 6 months 24.9–29.3%; after 12 months only 3.9–8.6%.
  • Cohort 2024-01 falls from 79.7% at M1 to 6.7% at M12 — a 73.0 pp decline over a year.

MRR growth

Total monthly recurring revenue from active subscriptions, Jan 2024 – Jun 2025. 1,086 user subscriptions are active at period end.

0 50000 100000 mrr 2024-01 — mrr: 4564 2024-02 — mrr: 10512 2024-03 — mrr: 17452 2024-04 — mrr: 25646 2024-05 — mrr: 32453 2024-06 — mrr: 36003 2024-07 — mrr: 46290 2024-08 — mrr: 49454 2024-09 — mrr: 58050 2024-10 — mrr: 62800 2024-11 — mrr: 65660 2024-12 — mrr: 69173 2025-01 — mrr: 70577 2025-02 — mrr: 75337 2025-03 — mrr: 81433 2025-04 — mrr: 84280 2025-05 — mrr: 89003 2025-06 — mrr: 94312 2024-01 2024-02 2024-03 2024-04 2024-05 2024-06 2024-07 2024-08 2024-09 2024-10 2024-11 2024-12 2025-01 2025-02 2025-03 2025-04 2025-05 2025-06 Month MRR, $
Key takeaways
  • MRR grew from $4,564 in Jan 2024 to $94,312 in Jun 2025 — 20.7x over 18 months.
  • At period end: enterprise contributes $35,964 (38.1%) of MRR, pro $33,075 (35.1%), business $25,273 (26.8%).

Signup→paid conversion by channel

Share of a channel's users that reached subscription: paid / channel users × 100%.

0 5 10 15 email — conversion: 12.1 12.1 organic — conversion: 13.2 13.2 paid_search — conversion: 14.6 14.6 referral — conversion: 11.7 11.7 social — conversion: 14.8 14.8 email organic paid_search referral social Acquisition channel Conversion, %
Key takeaways
  • Conversion is highest for social (14.8%) and paid_search (14.6%); lowest for referral (11.7%) and email (12.1%).
  • Organic contributes the most paying users in absolute terms: 427 of 1,086 (39.3% of all paid users) from 3,223 channel users.

See also

Connection map

Projects, posts and topics connected to this one. Hover a node to see its name; click to open.