Random Forest adds +0.03 ROC-AUC over logistic regression; the top churn driver is device-error rate (23.7%), not balance or activity.
Volta — Churn Prediction
Situation
Churn is not only a marketing problem: we need to know what actually drives leaving in order to pick a lever.
Task
My job was to find out what actually drives customers to leave, since churn is not only a marketing problem and the right lever has to be picked first.
Actions
Logistic regression vs Random Forest, ROC-AUC and feature importance.
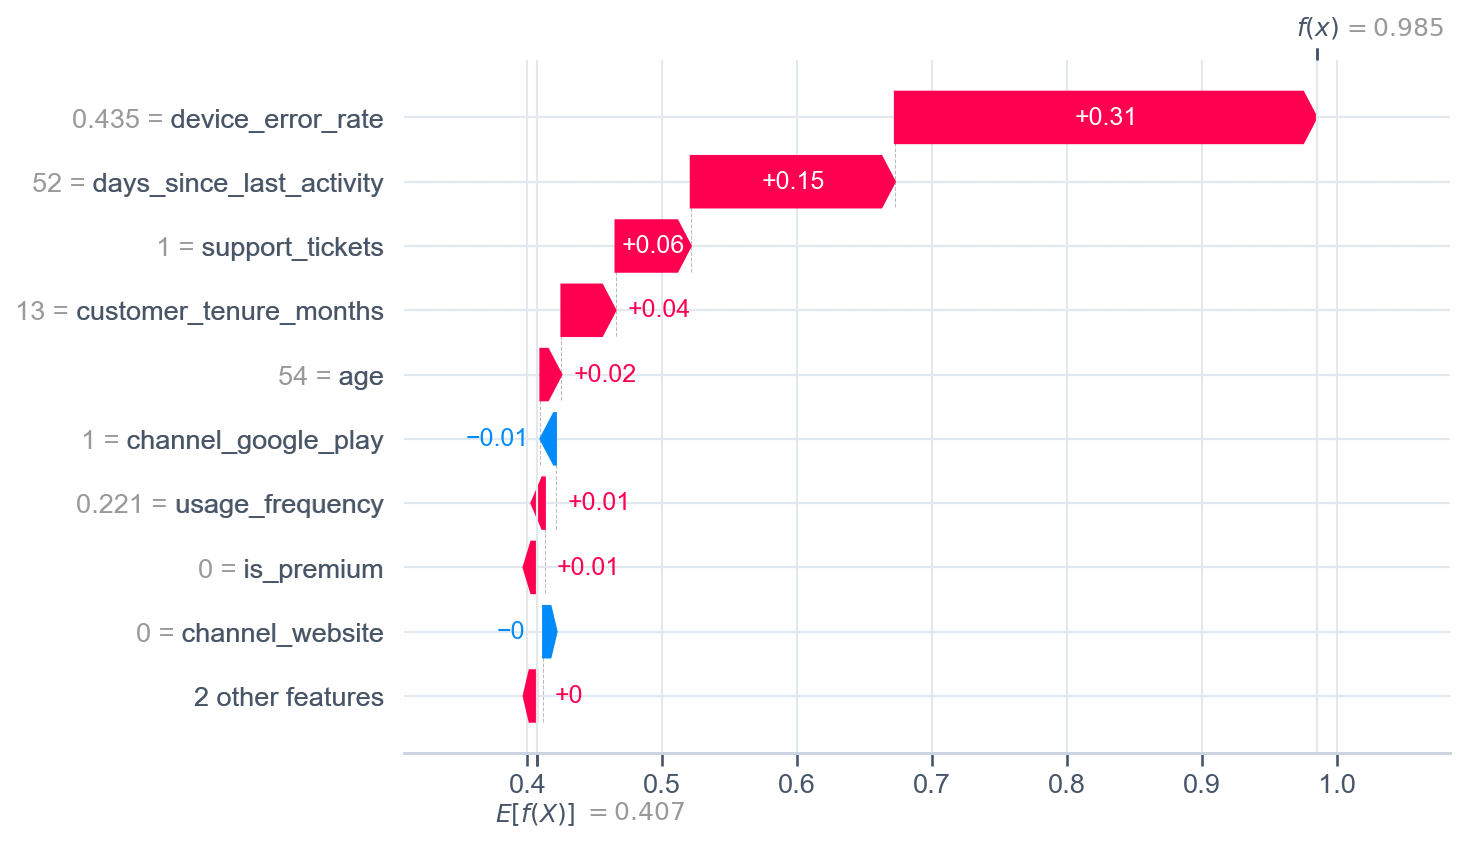
SHAP summary (mean |SHAP|) and local breakdown of a single prediction.
Local SHAP
Why one specific user is high risk: each feature’s contribution.
Result
Random Forest adds +0.03 ROC-AUC over LR — a modest but robust gain.
Top driver is device-error rate (23.7%) , then usage_frequency (18.7%) and days_since_last_activity (16.5%).
Balance and activity rank below product reliability.
Recommendations
Route churn prevention into product reliability and support, not just offers.
Use SHAP for targeted risk scoring.
Monitor device-error rate as a retention guardrail metric.
Documentation
Charts Source: github.com/NikitaBoyarkin/volta-banking — 22 projects; figures recomputed from the repo's own datasets (data/*.csv) via its analysis scripts. Funnel counts from data/volta_funnel_data.csv (10,000 users); A/B, retention, segmentation, churn, RFM, CLV, attribution, anomalies, spend, support, NPS, JTBD, unit economics, premium, KYC deep-dive, referral, assisted CAC, FX sourcing, premium offers, anchor CAC and dormant win-back follow the published project narrative (README + part pages).
Churn drivers: feature importance Random Forest feature importance (top 8) for churn prediction. RF adds +0.03 ROC-AUC over logistic regression.
0 10 20 30 device_error_rate — RF importance: 23.7 23.7 usage_frequency — RF importance: 18.7 18.7 days_since_last_activity — RF importance: 16.5 16.5 avg_transaction_value — RF importance: 11.2 11.2 age — RF importance: 9.2 9.2 customer_tenure_months — RF importance: 9.2 9.2 support_tickets — RF importance: 6.9 6.9 channel_google_play — RF importance: 1.3 1.3 device_error_rate usage_frequency days_since_last_activity avg_transaction_value age customer_tenure_months support_tickets channel_google_play Feature Importance, % Key takeaways The top churn driver is device-error rate (23.7%), not balance or activity. Prevention should run through product reliability/support: device_error_rate outranks usage_frequency (18.7%). Churn model ROC curves True Positive Rate vs False Positive Rate for logistic regression and Random Forest on the hold-out set (25% of data).
0 0.5 1 Logistic Regression 0.00 — Logistic Regression: 0 0.01 — Logistic Regression: 0.17 0.03 — Logistic Regression: 0.27 0.04 — Logistic Regression: 0.34 0.06 — Logistic Regression: 0.41 0.08 — Logistic Regression: 0.45 0.10 — Logistic Regression: 0.5 0.12 — Logistic Regression: 0.54 0.14 — Logistic Regression: 0.57 0.17 — Logistic Regression: 0.61 0.19 — Logistic Regression: 0.64 0.22 — Logistic Regression: 0.68 0.25 — Logistic Regression: 0.71 0.28 — Logistic Regression: 0.74 0.33 — Logistic Regression: 0.77 0.37 — Logistic Regression: 0.79 0.41 — Logistic Regression: 0.82 0.46 — Logistic Regression: 0.85 0.51 — Logistic Regression: 0.87 0.57 — Logistic Regression: 0.89 0.65 — Logistic Regression: 0.92 0.71 — Logistic Regression: 0.94 0.78 — Logistic Regression: 0.96 0.86 — Logistic Regression: 0.98 1.00 — Logistic Regression: 1 Random Forest 0.00 — Random Forest: 0 0.01 — Random Forest: 0.05 0.03 — Random Forest: 0.13 0.04 — Random Forest: 0.21 0.06 — Random Forest: 0.27 0.08 — Random Forest: 0.32 0.10 — Random Forest: 0.37 0.12 — Random Forest: 0.43 0.14 — Random Forest: 0.49 0.17 — Random Forest: 0.52 0.19 — Random Forest: 0.55 0.22 — Random Forest: 0.6 0.25 — Random Forest: 0.65 0.28 — Random Forest: 0.69 0.33 — Random Forest: 0.73 0.37 — Random Forest: 0.77 0.41 — Random Forest: 0.81 0.46 — Random Forest: 0.84 0.51 — Random Forest: 0.87 0.57 — Random Forest: 0.89 0.65 — Random Forest: 0.92 0.71 — Random Forest: 0.95 0.78 — Random Forest: 0.98 0.86 — Random Forest: 0.99 1.00 — Random Forest: 1 0.00 0.06 0.14 0.25 0.41 0.65 1.00 False Positive Rate True Positive Rate Logistic Regression Random Forest Key takeaways Random Forest beats logistic regression by +0.03 ROC-AUC — the non-linearity adds signal. At FPR ≈ 0.10 Random Forest catches 37% of churn, logistic regression 50%: the RF edge is in the area under the curve, not any single point. SHAP importance of churn drivers Mean |SHAP| over 500 users: each feature’s contribution to the churn prediction, in logit units.
0 0.05 0.1 0.15 0.2 device_error_rate — mean |SHAP|: 0.15 0.15 days_since_last_activity — mean |SHAP|: 0.1 0.1 support_tickets — mean |SHAP|: 0.09 0.09 usage_frequency — mean |SHAP|: 0.08 0.08 customer_tenure_months — mean |SHAP|: 0.04 0.04 avg_transaction_value — mean |SHAP|: 0.01 0.01 is_premium — mean |SHAP|: 0.01 0.01 channel_website — mean |SHAP|: 0.01 0.01 device_error_rate days_since_last_activity support_tickets usage_frequency customer_tenure_months avg_transaction_value is_premium channel_website mean |SHAP| Key takeaways device_error_rate is the top driver (0.150 mean |SHAP|), 1.5× the next feature. Device errors and days-since-activity (0.102) outweigh support tickets and usage frequency combined.